. 2010 Aug;11(8):751-8.
doi: 10.1038/ni.1904. Epub 2010 Jul 11.

Eicosanoid pathways regulate adaptive immunity to Mycobacterium tuberculosis

Affiliations

Eicosanoid pathways regulate adaptive immunity to Mycobacterium tuberculosis

Maziar Divangahi et al. Nat Immunol. 2010 Aug.

Abstract

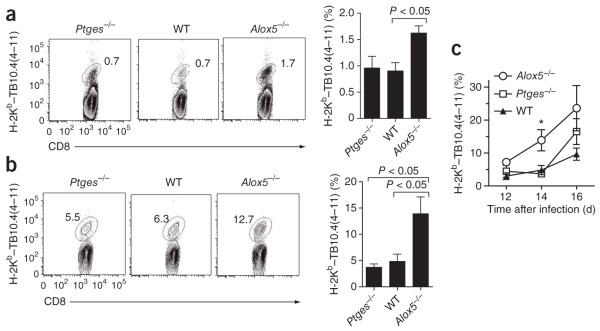
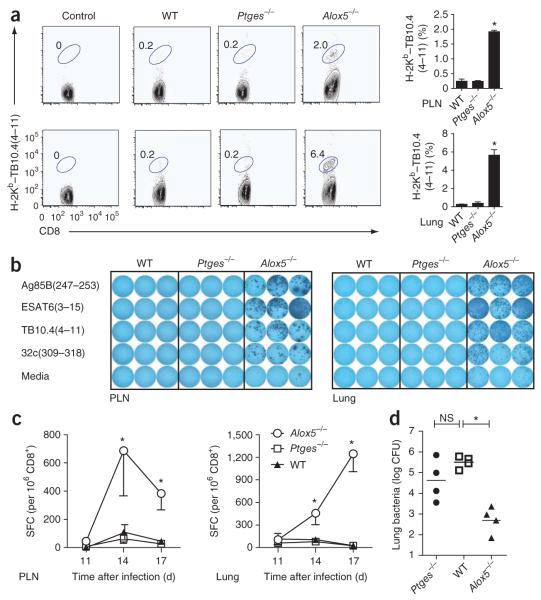
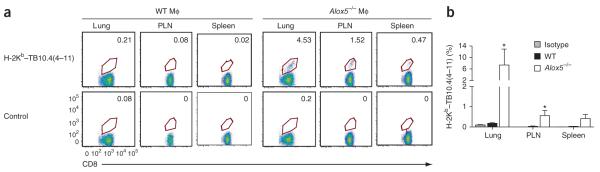
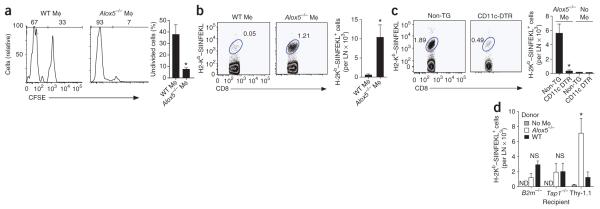
The fate of infected macrophages has an essential role in protection against Mycobacterium tuberculosis by regulating innate and adaptive immunity. M. tuberculosis exploits cell necrosis to exit from macrophages and spread. In contrast, apoptosis, which is characterized by an intact plasma membrane, is an innate mechanism that results in lower bacterial viability. Virulent M. tuberculosis inhibits apoptosis and promotes necrotic cell death by inhibiting production of prostaglandin E(2). Here we show that by activating the 5-lipoxygenase pathway, M. tuberculosis not only inhibited apoptosis but also prevented cross-presentation of its antigens by dendritic cells, which impeded the initiation of T cell immunity. Our results explain why T cell priming in response to M. tuberculosis is delayed and emphasize the importance of early immunity.


Figures

Figure 1
Figure 1
Inhibition by 5-lipoxygenase of the early initiation of an immune response after M. tuberculosis infection. (a,b) Frequency of TB10.4(4–11)-specific CD8+ T cells in the thoracic draining lymph nodes (a) and lungs (b) of Ptges−/−, wild-type (WT) and Alox5−/− mice 2 weeks after M. tuberculosis infection. Numbers adjacent to outlined areas indicate percent CD8+ T cells stained with the TB10.4(4–11)-loaded H-2Kb tetramer (H-2Kb–TB10.4(4–11)). Data are representative of two independent experiments (mean of four to five mice per group). (c) Kinetics of the pulmonary TB10.4-specific CD8+ T cell response in Ptges−/−, wild-type and Alox5−/− mice. *P < 0.05 (one-way analysis of variance (ANOVA)). Data are representative of two experiments (mean ± s.e.m. of four mice per group).
Figure 2
Figure 2
Transfer of M. tuberculosis–infected Alox5−/− macrophages into wild-type mice recapitulates the phenotype of intact Alox5−/− mice. (a) Frequency of TB10.4(4–11)-specific CD8+ T cells in the thoracic draining lymph nodes (top) and lungs (bottom) 17 d after intratracheal transfer of M. tuberculosis H37Rv–infected Alox5−/−, Ptges−/− or wild-type macrophages into wild-type mice. Numbers adjacent to outlined areas indicate percent CD8+ T cells stained with H-2Kb–TB10.4(4–11). Data are representative of four independent experiments (mean and s.e.m. of 16 total mice per group). (b) Enzyme-linked immunospot assay of IFN-γ production showing the frequency of M. tuberculosis–specific CD4+ and CD8+ T cells 17 d after intratracheal transfer of M. tuberculosis H37Rv–infected Ptges−/−, wild-type or Alox5−/− macrophages into wild-type mice; splenic T cells from the wild-type recipient mice were cultured with APCs and Ag85B(241–256), ESAT6(3–15), TB10.4(4–11) or 32c(309–318). Data are representative of three experiments. (c) Kinetics of PLN and lung TB10.4-specific CD8+ T cell responses in recipient mice after transfer of infected Ptges−/−, wild-type or Alox5−/− macrophages. SFC, spot-forming cells. Data are representative of two experiments (mean ± s.e.m. of four mice per group). (d) Bacterial burden in the lung 28 d after intratracheal transfer of M. tuberculosis H37Rv–infected Alox5−/−, Ptges−/− or wild-type macrophages into wild-type mice. Each symbol represents an individual mouse; small horizontal bars indicate the mean. Data are from two independent experiments (n = 4 mice per group). NS, not significant; *P < 0.05, compared with wild-type (one-way ANOVA).
Figure 3
Figure 3
Transfer of infected Alox5−/− alveolar macrophages generates pulmonary and systemic CD4+ and CD8+ T cell responses. (a) Frequency of TB10.4(4–11)-specific CD8+ T cells in the lungs, PLN and spleen 17 d after intratracheal transfer of alveolar macrophages (MΦ) from wild-type mice (left) or Alox5−/− mice (right) infected by aerosol with M. tuberculosis (virulent Erdman strain). Numbers adjacent to outlined areas indicate percent CD8+ T cells stained with H-2Kb–TB10.4(4–11) or streptavidin-phycoerythrin alone (Control; bottom row). Data are from one experiment. (b) Frequency of H-2Kb–TB10.4(4–11)–stained CD8+ T cells in the lungs, PLN and spleens of mice treated as described in a (n = 5 per group). Staining with isotype-matched control antibody (Isotype) is shown for the wild-type group only. *P < 0.05 (one-way ANOVA with the Bonferroni post-test). Data are from one experiment (mean and s.e.m.).
Figure 4
Figure 4
CD8+ T cell activation induced by M. tuberculosis–infected Alox5−/− macrophages requires cross-presentation by CD11c+ DCs. (a,b) CD8+ T cell proliferation (a) and population expansion of cells positive for the H-2Kb–SIINFEKL pentamer (b) 5 d after intravenous transfer of CFSE-labeled Thy-1.2+ splenic OT-I CD8+ T cells into Thy-1.1+ B6.PL mice, followed within 24 h by M. tuberculosis H37Rv–infected wild-type or Alox5−/− macrophages pulsed with SIINFEKL. Numbers above bracketed lines (a) indicate percent CFSE cells (left) or CFSE+ cells (right); numbers adjacent to outlined areas (b) indicate percent CD8+ T cells stained with H-2Kb–SIINFEKL. (c) Frequency of SIINFEKL-specific CD8+ T cells in the draining lymph nodes of CD11c-DTR–transgenic mice (CD11c-DTR) and nontransgenic littermate control mice (Non-TG) given intravenous injection of OT-I CD8+ T cells, followed by subcutaneous transfer of M. tuberculosis H37Rv–infected, SIINFEKL-pulsed Alox5−/− macrophages and treatment with diphtheria toxin. No Mϕ (right), control mice that did not receive macrophages. Numbers adjacent to outlined areas indicate percent CD8+ T cells stained with H-2Kb–SIINFEKL after 5 d. Data are representative of three experiments (mean and s.e.m. of four to five mice per group). (d) OVA-specific OT-I CD8+ T cells in draining lymph nodes of β2-microglobulin-deficient (B2m−/−), TAP-1-deficient (Tap1−/−) or Thy-1.1+ recipient mice 5 d after the transfer of CFSE-labeled Thy-1.2+ splenic OT-I CD8+ T cells and M. tuberculosis H37Rv–infected, SIINFEKL-pulsed wild-type or Alox5−/− macrophages. Data are representative of two to three independent experiments (mean ± s.e.m. of three to five mice per group). *P < 0.05 (one-way ANOVA).
Figure 5
Figure 5
Caspase-dependent apoptosis of M. tuberculosis-infected Alox5−/− macrophages is required for the early initiation of T cell immunity. (a) Apoptosis of Alox5−/− macrophages infected with M. tuberculosis H37Rv (multiplicity of infection, ~2), assessed 3 d after treatment for 2 h with a negative control peptide (Negative control) or with an inhibitor of caspase-8 or caspase-9 or both (0.5 μM each), presented relative to that of uninfected Alox5−/− macrophages (Untreated). *P < 0.05, compared with control group (one-way ANOVA with Dunnett’s multiple-comparison test). Data are representative of three experiments (mean and s.e.m.). (b) Frequency of TB10.4(4–11)-specific CD8+ T cells in the lungs of mice 17 d after the intratracheal transfer of M. tuberculosis H37Rv–infected Alox5−/− macrophages treated with inhibitors of caspase-8 and caspase-9 (Both inhibitors) or a negative control peptide (Negative control); results (right) are normalized by division of the absorbance by the absorbance of cultures of uninfected macrophages. Numbers adjacent to outlined areas indicate percent CD8+ T cells stained with H-2Kb–TB10.4(4–11). *P < 0.05 (Mann-Whitney test). Data are representative of two independent experiments (mean and s.e.m. of four mice per group). Supplementary Figure 1. The immune response is similar in Ptges−/−, wild type, and Alox5−/− mice five weeks after Mtb infection. The frequency of TB10.4(4-11)-specific CD8+ T cells was determined five weeks after aerosol Mtb infection (~100 CFU) in the lungs (a) and the spleens (b) of Ptges−/−, wild type, and Alox5−/− mice. The percentage of CD8+ T cells that stained with the H-2 Kb–TB10.4(4-11) tetramer is indicated in each representative FACS plot. Each bar is the mean ± SE, of 5 individual mice. (c) The pulmonary bacterial burden in Ptges−/−, wild type, and Alox5−/− mice (n=5/group) five weeks after infection with aerosolized Mtb. Results are representative of two independent experiments. *, p<0.05 by a one-way ANOVA compared to wild type group, or †, p<0.05 Alox5−/− vs. Ptges−/−. Supplementary Figure 2. The intrinsic ability of T cells from Ptges−/−, wild type, and Alox5−/− mice to provide protection against pulmonary Mtb infection is similar. (a) Sublethally irradiated wild type mice were used as recipients for splenic T cells (CD3+) from Mtb infected Ptges−/−, wild type, or Alox5−/− mice. Recipient mice were infected with Mtb by the aerosol route within 24 hrs after transfer of purified T cells. Three weeks after infection, the bacterial burden in the lung and spleen were determined. Each point represents data from an individual mouse, and the bars represent the mean (n=4-5 mice per group). The differences in lung CFU between Ptges−/− and wild type, or wild type and Alox5−/− mice were not significant (as determined by a one-way ANOVA). (b) Control experiment done under the same conditions as (a). Recipient mice were irradiated and purified splenic T cells from Mtb infected syngeneic mice were transferred intravenously (WT). These were compared to control mice that did not receive T cells (No Tx). These two groups were infected as above and analyzed after three weeks. The difference in lung CFU was very significant as determined using a t-test (p = 0.0002). Supplementary Figure 3. Adoptively transferred macrophages traffic into the lung. Uninfected CD45.2+ macrophages were transferred into CD45.1 recipient mice via the intratracheal route. The presence of donor CD45.2+ macrophages was evaluated in the air space (by bronchoalveolar lavage) and lung tissue (after collagenase digestion) 6h, 24h, 48h, and 7 days after adoptive transfer. Supplementary Figure 4. The frequency of TB10.4(4-11) specific CD8+ T cells in the lungs and spleens of wild type mice is similar 28 days after the intratracheal transfer of H37Rv-infected Ptges−/−, wild type, or Alox5−/− macrophages. Representative of FACS plots showing the H-2 Kb–TB10.4(4-11) tetramer staining of CD8+ T cells from the lung (top row) or spleen (bottom row) of recipient mice 4 weeks after infected macrophages transfer. The frequency of TB10.4(4-11)-specific CD8+ T cells is indicated in each plot and in the bar graph. Bars, mean ± SE bar graph of 4 mice per group. Supplementary Figure 5. The frequency of Mtb-specific CD4+ and CD8+ T cells following adoptive transfer of Mtb infected alveolar macrophages from wild-type or Alox5−/− mice into naïve wild type mice. Seventeen days after the adoptive transfer of Mtb infected alveolar macrophages from wild type or Alox5−/− mice into wild type recipient mice, the frequency of Mtb-specific CD4+ and CD8+ T cells was enumerated using an IFN-γ elispot to measure the response to Ag85B(247-256), ESAT6(3-15), TB10.4(4-11), or 32c(309-318) synthetic peptides in the lungs, pulmonary lymph nodes (PLN), and spleens. Mice that received Alox5−/− alveolar macrophages had larger IFN-γ responses to ESAT6 (CD4+ T cell epitope) and TB10.4 (CD8+ T cell epitope) in the PLN and spleen, respectively, at this early time point (p<0.05, t-test). Statistical analysis of the other elispot responses is difficult because many of the mice that received wild type alveolar macrophages had no detectable response, and the Alox5−/− alveolar macrophages group showed significant variability in their responses. To compare the magnitude of the response, recipient mice were categorized as responders or non-responders based on detection of IFN-γ secreting T cells. When all the possible responses were analyzed in aggregate, it was clear that transfer of infected Alox5−/− alveolar macrophages induced a better response than elicited by infected wild type alveolar macrophages (p < 0.0001 by Fischer exact test). Supplementary Figure 6. Ptges−/−, wild type, and Alox5−/− macrophages have a similar ability to process and present antigen. Ptges−/−, wild type, and Alox5−/− macrophages were pulsed with different concentration of sonicated Mtb, Mtb-culture filtrate proteins, Ag85 protein, or Ag85B(241-256) peptide, for 6 hrs. BB7 hybidoma cells were added to macrophages and IL-2 production was measured in the supernatants 24 hrs later. The ratio of the macrophages to T cells was 1:1. Values represent mean ± SE of triplicate samples. Supplementary Figure 7. Wild type and Alox5−/− macrophages have a similar capacity to enhance OVA-antigen specific T cell response in the absence of Mtb infection. (a) CD8+ T cell proliferation 5 days after IV transfer of CFSE-labeled Thy1.2+ splenic OT-I CD8+ T cells into Thy1.1+ B6.PL mice followed within 24 hrs by uninfected wild type or Alox5−/− macrophages pulsed with SIINFEKL. (b) Purified CD45.1+ OT-1 CD8+ T cells were injected IV into CD45.2+ C57BL/6 mice (n=2-5/group). Within 24 hours, uninfected wild type or Alox5−/− macrophages cultured with SIINFEKL (pOVA) and treated with LPS (100 ng/ml) or staurosporine (1 μM) for 6 hrs. OT-1 cells were identified as CD45.1+CD8+Vβ5+Vα2+ cells. The frequency of OT-1 cells in each draining LN is shown. Bars represent mean ± SE. Supplementary Figure 8. In vivo depletion of CD11c+ cells. Three different doses of diphtheria toxin (DT) (25, 50, 100 ng/mouse) were administered by the IP route to CD11c–DTR TG and non-TG littermate mice. The frequency of CD11c+ cells were measured in the spleens 24 hours later. The majority of CD11c+ cells were depleted following 100 ng of DT compared to their littermate non-tg controls.

References

    1. Barry CE, III, et al. The spectrum of latent tuberculosis: rethinking the biology and intervention strategies. Nat. Rev. Microbiol. 2009;7:845–855. - PMC - PubMed
    1. Bhatt K, Salgame P. Host innate immune response to Mycobacterium tuberculosis. J. Clin. Immunol. 2007;27:347–362. - PubMed
    1. Russell DG, Mwandumba HC, Rhoades EE. Mycobacterium and the coat of many lipids. J. Cell Biol. 2002;158:421–426. - PMC - PubMed
    1. Sturgill-Koszycki S, Schaible UE, Russell DG. Mycobacterium-containing phagosomes are accessible to early endosomes and reflect a transitional state in normal phagosome biogenesis. EMBO J. 1996;15:6960–6968. - PMC - PubMed
    1. Fink SL, Cookson BT. Apoptosis, pyroptosis, and necrosis: mechanistic description of dead and dying eukaryotic cells. Infect. Immun. 2005;73:1907–1916. - PMC - PubMed

Publication types

MeSH terms