. 2010 Sep 23;29(38):5299-310.
doi: 10.1038/onc.2010.261. Epub 2010 Jul 12.

HMGB1 release and redox regulates autophagy and apoptosis in cancer cells

Affiliations

HMGB1 release and redox regulates autophagy and apoptosis in cancer cells

D Tang et al. Oncogene. .

Erratum in

Abstract

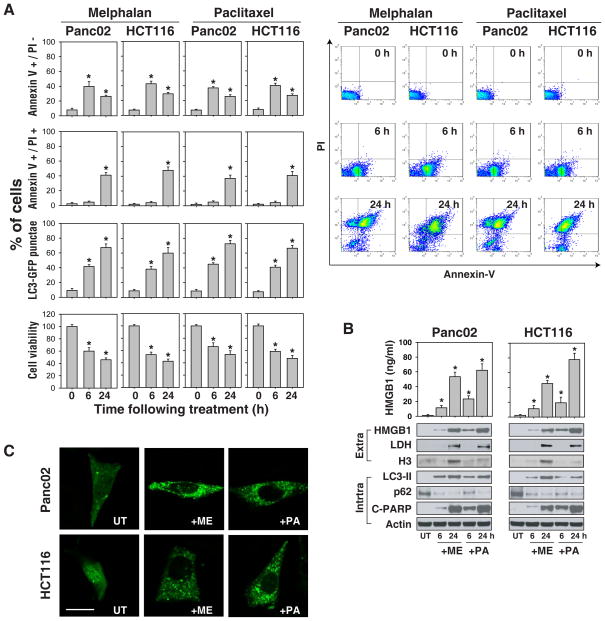
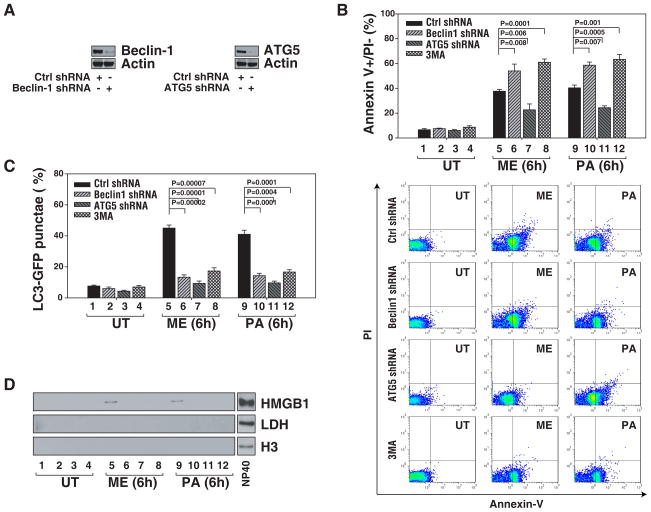
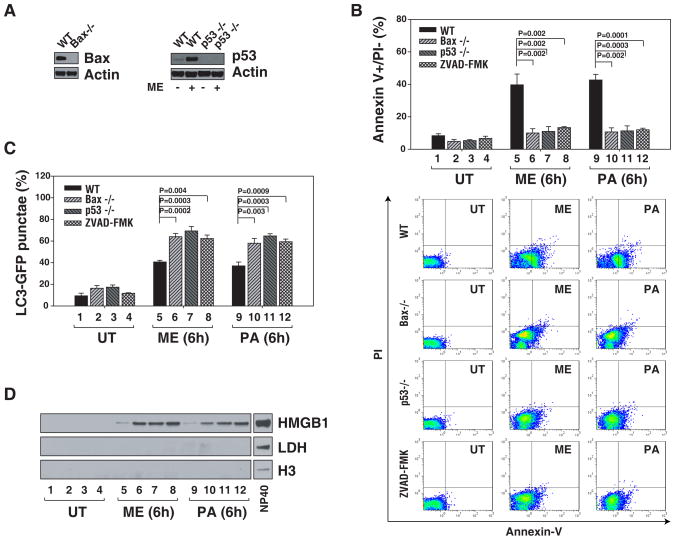
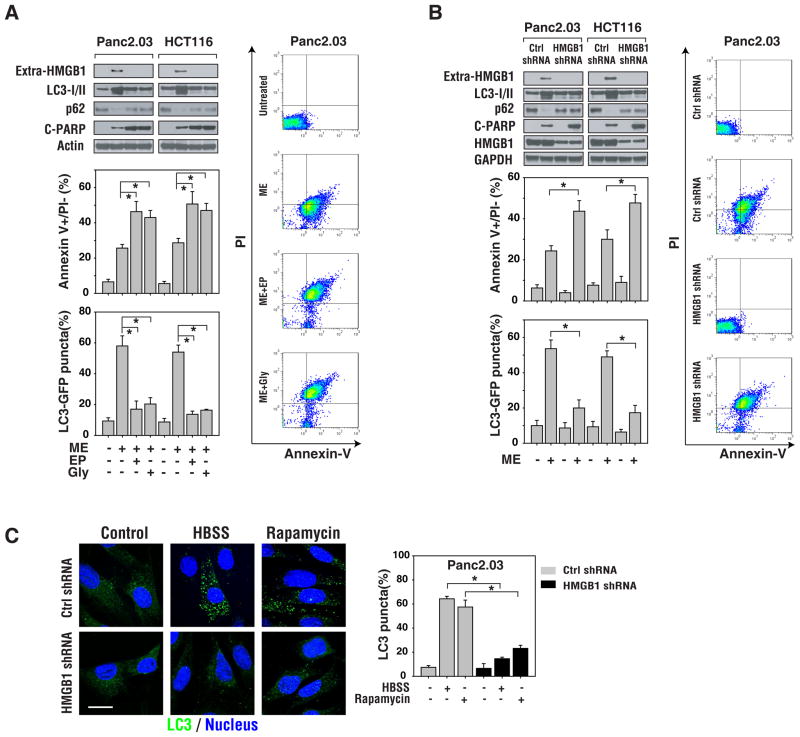
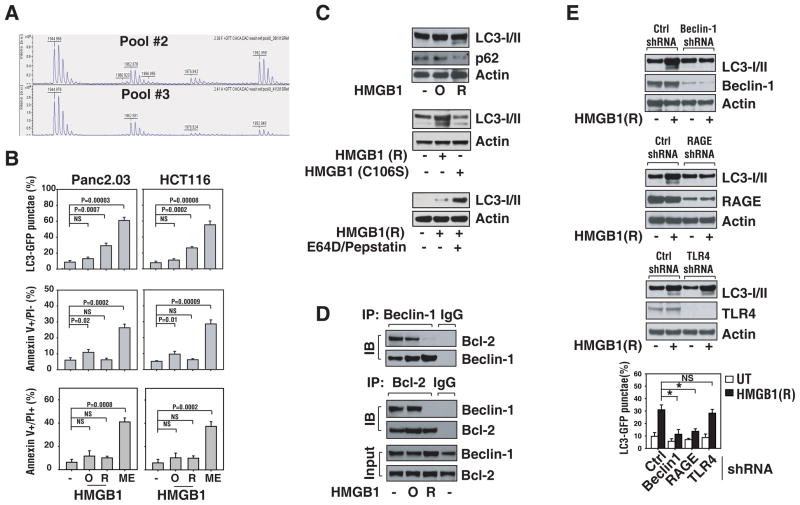
The functional relationship and cross-regulation between autophagy and apoptosis is complex. In this study we show that the high-mobility group box 1 protein (HMGB1) is a redox-sensitive regulator of the balance between autophagy and apoptosis. In cancer cells, anticancer agents enhanced autophagy and apoptosis, as well as HMGB1 release. HMGB1 release may be a prosurvival signal for residual cells after various cytotoxic cancer treatments. Diminished HMGB1 by short hairpin RNA transfection or inhibition of HMGB1 release by ethyl pyruvate or other small molecules led predominantly to apoptosis and decreased autophagy in stressed cancer cells. In this setting, reducible HMGB1 binds to the receptor for advanced glycation end products (RAGEs), but not to Toll-like receptor 4, induces Beclin1-dependent autophagy and promotes tumor resistance to alkylators (melphalan), tubulin disrupting agents (paclitaxel), DNA crosslinkers (ultraviolet light) and DNA intercalators (oxaliplatin or adriamycin). On the contrary, oxidized HMGB1 increases the cytotoxicity of these agents and induces apoptosis mediated by the caspase-9/-3 intrinsic pathway. HMGB1 release, as well as its redox state, thus links autophagy and apoptosis, representing a suitable target when coupled with conventional tumor treatments.


Conflict of interest statement

CONFLICT OF INTEREST

The authors declare no conflict of interest.

Figures

Figure 1
Figure 1. Cell injury/stress promotes HMGB1 release from cancer cell lines
(A) Small molecule anticancer agents decreased cell viability and induced both apoptotic and autophagic pathways. Panc02 and HCT116 cancer cells were treated with either a DNA alkylating agent or a tubulin depolymerization inhibitor (melphalan, “ME”, 160 μg/ml; paclitaxel, “PA”, 10 μg/ml respectively) for 0–24 h, and then assayed for cell viability using measures of NADH dehydrogenases [CCK8], apoptosis by flow cytometric analaysis (right panel) using Annexin V/PI stain and autophagy by quantification of the percentage of cells with GFP-LC3 punctae as described in methods (N=3, * p<0.05 versus control group). (B) The anticancer agents indicated in (A) induced HMGB1 release by ELISA assay (N=3, * p<0.01 versus untreated “UT” group, top), and western blot analysis (bottom), A representative western blot analysis of the protein levels indicated is included (LDH and H3 were both used as controls for protein leakage from damaged cells). (C) GFP-LC3 punctae are induced by melphalan and paclitaxel following 6 h treatment in Panc2.03 cells transfected with a GFP-LC3 reporter plasmid. “UT”: untreated. The percentage of cells showing accumulation of GFP-LC3 in punctae is reported in panel (A). Bar=20 μm.
Figure 2
Figure 2. Inhibition of autophagy diminishes HMGB1 release and enhances selective apoptosis
(A) Immunoblots are shown for Beclin1 and ATG5 knockdown performed in Panc02 cells. (B–D) Panc02 cells as indicated were treated with the anticancer agents (melphalan, “ME”, 160 μg/ml; paclitaxel, “PA”, 10 μg/ml) for 6 h. and then assayed for early apoptosis (annexin V+/PI−) by flow cytometry (B), autophagy by quantification of the percentage of cells with GFP-LC3 punctae (C) and HMGB1 release, by western blotting analysis (LDH and H3 were both used as controls for protein leakage from damaged cells) (D). PI3-kinase inhibitor 3-methyladenine (3MA, 5mm) was used as a nominal autophagy inhibitor. Representative western blots of the indicated proteins are presented.
Figure 3
Figure 3. HMGB1 release and autophagy is detected in the absence of measurable apoptosis
(A) Immunoblots are shown for Bax and p53 knockout in HCT116 cells. (B-D) WT, Bax knock out, p53 knockout or pan-caspase inhibitor treated (ZVAD-FMK, 20 μm) HCT116 cells were treated with melphalan, “ME”, 160 μg/ml or paclitaxel, “PA”, 10 μg/ml for 6 h. and then assayed for measures of early apoptosis (annexin V+/PI−) by flow cytometry (B), autophagy by quantification of the percentage of cells with GFP-LC3 punctae (C) and HMGB1 release by western blot analysis (LDH and H3 were both used as controls for protein leakage from damaged cells) (D). Representative western blots of the indicated proteins are presented.
Figure 4
Figure 4. Inhibition of HMGB1 release increases tumor cell sensitivity to anticancer agents
(A) Inhibition of HMGB1 release with small molecule drugs increases tumor cell sensitivity to anticancer agents. Panc2.03 and HCT116 cells were pretreated with the HMGB1-release inhibitors ethyl pyruvate (EP, 10 mm) or glycyrrhizin (Gly, 500 μm) for 2 h and then cultured in the presence of melphalan for an additional 24 h. Representative western blotting analysis of protein levels are presented. In parallel, measures of apoptosis (annexin V+/PI−) were assayed by flow cytometry and autophagy by quantifying the percentage of cells with GFP-LC3 punctae. (B) Panc2.03 and HCT116 cells were knocked down for HMGB1 using shRNA for 48 h, and then stimulated with melphalan for 24 h. Representative western blotting analysis of protein levels is presented. In parallel, apoptosis (annexin V+/PI−) was assayed by flow cytometry (right panel) and autophagy by quantifying the percentage of cells with GFP-LC3 punctae (N=3, p<0.01). Representative FACS plots are presented. (C) HMGB1 was knocked down in Panc2.03 using shRNA for 48 h, and then these cells were stimulated with starvation (HBSS, 3 h) and rapamycin (1 μm, 6 h). Autophagy was evaluated using the percentage of cells with LC3 punctae (N=3, p<0.01). Representative image are presented. Bar=20 μm.
Figure 5
Figure 5. Provision of exogenous reduced HMGB1 increases autophagy in cancer cells
(A) Relative amounts of oxidized Cys106 (as Cys sulfonic acid) in Lilly Pool #2 and #3. MALDI-TOF Mass Spectrum of tryptic fragments of Lilly Pool #2 (top) and Pool #3 (bottom). The Cys106 containing fragment is amino acids 97–112. The free sulfhydryl (-SH) of total reducible cysteine is at a mass of 1944.9 Da. The monoxide is faintly seen at a mass of 1960.9 Da. The di- and tri- oxides are at masses of 1976.9 Da and 1992.9 Da, respectively. The peak at 1962.9 Da is the free sulfhydryl of the 13–28 fragments, used as an internal standard to verify the DTT reduction went to completion. (B) Reduced HMGB1 protein induces autophagy and oxidized HMGB1 mildly induces apoptosis. Panc2.03 and HCT116 cancer cells were treated with oxidized HMGB1 (“O”, 10 μg/ml) or reduced HMGB1 (“R”, 10 μg/ml) for 24 h, and then assayed for apoptosis by FACS using Annexin V/PI stain and autophagy by quantification of the percentage of cells with GFP-LC3 dots as described in methods. (C) Western analysis of LC3 processing in the presence or absence of lysosomal protease inhibitors pepstatin A (10 μg/ml) and E64D (10 μg/ml) and degradation of p62 by autophagy after HMGB1 or HMGB1 C106S mutant treatment. (D) Reduced HMGB1 protein regulates Beclin1/Bcl-2 complex formation in autophagy. Panc2.03 cells were treated with oxidized HMGB1 (“O”, 10 μg/ml) or reduced HMGB1 (“R”, 10 μg/ml), for 6 h, then cell lysates were prepared for IP with anti-Beclin1/-Bcl-2 or IgG. The resulting immune complexes and inputs were analyzed by western blotting as indicated. Representative western blotting analysis of protein levels is presented. (E) RAGE/Beclin1 but not TLR4 is required for HMGB1 mediated autophagy. Cells were transfected with the indicated shRNA for 48 h and then were treated with reduced HMGB1 (“R”, 10 μg/ml) for 24 h. Representative western blotting analysis of protein levels is presented. In parallel, autophagy was assayed by the percentage of cells with GFP-LC3 dots (N=3, * p<0.001).
Figure 6
Figure 6. Redox of HMGB1 regulates chemotherapy effectiveness
(A) Cell viability and apoptosis assay. Panc2.03 and HCT116 cells were treated with oxaliplatin (160 μg/ml), melphalan (320 μg/ml), adriamycin (1.6 μg/ml), paclitaxel (20 μg/ml) with or without oxidized HMGB1 (“O”, 10 μg/ml) or reduced HMGB1 (“R”, 10 μg/ml). Cell death was analysis at indicated time by CCK-8 cell viability assay (n=3, * and #, p< 0.05 versus no HMGB1 group, left panel). In parallel, cell death was assayed by Annexin-V/PI using flow cytometry when Panc2.03 and HCT116 cells were exposed to paclitaxel (20 μg/ml) for 48 h (right panel). (B) Colony formation assay. Panc2.03 and HCT116 cells were treated with oxaliplatin (160 μg/ml), melphalan (320 μg/ml), adriamycin (1.6 μg/ml), paclitaxel (20 μg/ml) with or without oxidized HMGB1 (“O”, 10 μg/ml) or reduced HMGB1 (“R”, 10 μg/ml) for 24 h or 72 h, then 1, 000 cells were plated into 24 well plates. Colonies were visualized by crystal violet staining 3 weeks later. (C) Effects of caspase inhibitors on oxidized HMGB1-induced caspase 3 activity. Panc2.03 cells were treated with HMGB1 (“O”, 10 μg/ml) with or without a pan-caspase inhibitor (ZVAD-FMK, 20 μM), caspase-3 inhibitor (Z-DEVD-FMK, 20 μM), caspase-8 inhibitor (Z-IETD-FMK, 20 μM) or caspase-9 inhibitor (Z-LEHD-FMK, 20 μM) for 24 h, and then analyzed Caspase 3 activity. (n=3, ** p<0.001, *** p<0.0001). (D) The relationship between HMGB1 release and autophagy. Anticancer agents such as melphalan and paclitaxel promote HMGB1 release. Redox status of the tumor microenvironment and internal environment decides the activity and function of HMGB1. Reduced extracellular HMGB1 binds to the RAGE receptor but not TLR4 and induces Beclin1-dependent autophagy, which in turn promotes tumor survival. In addition, oxidized HMGB1 increases the cytotoxicity of anticancer agents and induces apoptosis via activation of caspase-3 and -9. HMGB1 is involved in the cross-regulation between autophagy and apoptosis.

References

    1. Amaravadi RK, Thompson CB. The roles of therapy-induced autophagy and necrosis in cancer treatment. Clin Cancer Res. 2007;13:7271–9. - PubMed
    1. Apel A, Herr I, Schwarz H, Rodemann HP, Mayer A. Blocked autophagy sensitizes resistant carcinoma cells to radiation therapy. Cancer Res. 2008;68:1485–94. - PubMed
    1. Apetoh L, Ghiringhelli F, Tesniere A, Obeid M, Ortiz C, Criollo A, et al. Toll-like receptor 4-dependent contribution of the immune system to anticancer chemotherapy and radiotherapy. Nat Med. 2007;13:1050–9. - PubMed
    1. Azad MB, Chen Y, Gibson SB. Regulation of autophagy by reactive oxygen species (ROS): implications for cancer progression and treatment. Antioxid Redox Signal. 2009;11:777–90. - PubMed
    1. Bell CW, Jiang W, Reich CF, 3rd, Pisetsky DS. The extracellular release of HMGB1 during apoptotic cell death. Am J Physiol Cell Physiol. 2006;291:C1318–25. - PubMed

Publication types

MeSH terms