. 2010 Sep 15;50(19):1928-40.
doi: 10.1016/j.visres.2010.06.016. Epub 2010 Jul 16.

Specificity of perceptual learning increases with increased training

Affiliations

Specificity of perceptual learning increases with increased training

Pamela E Jeter et al. Vision Res. .

Abstract

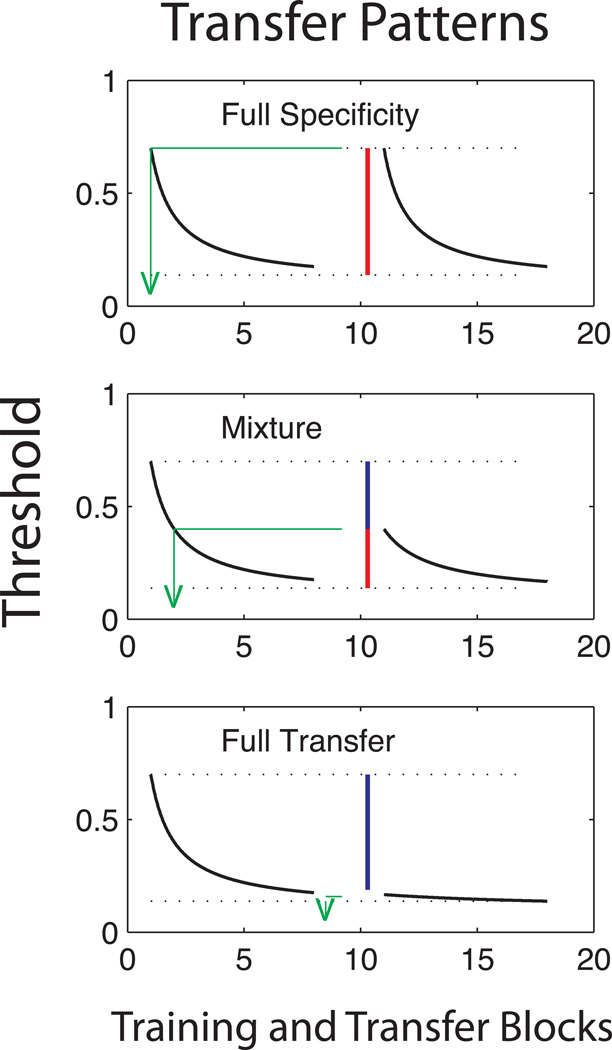
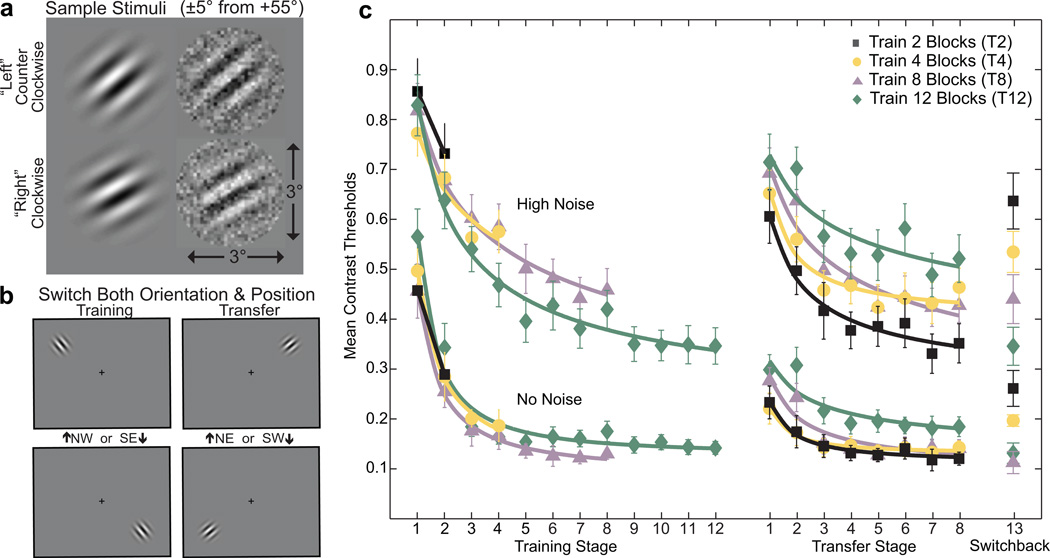
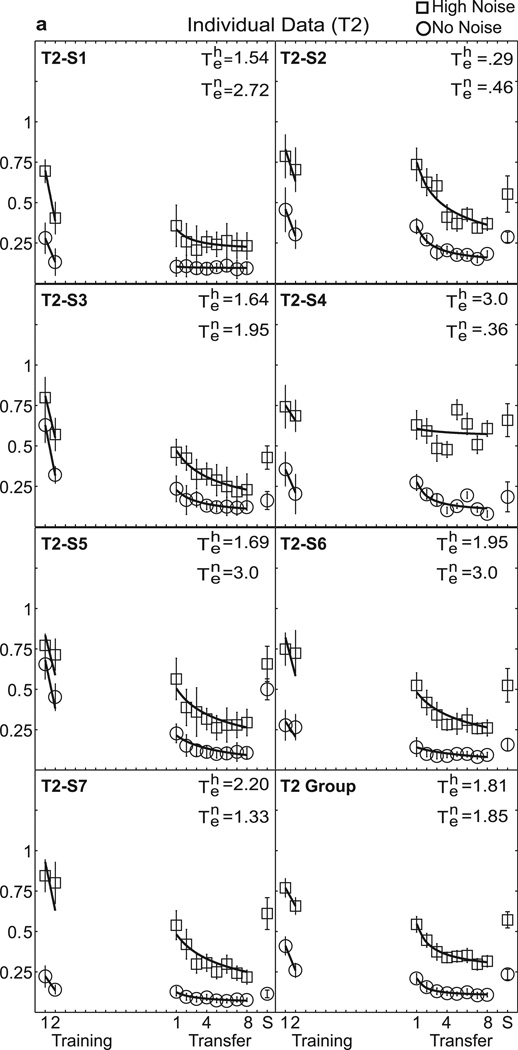
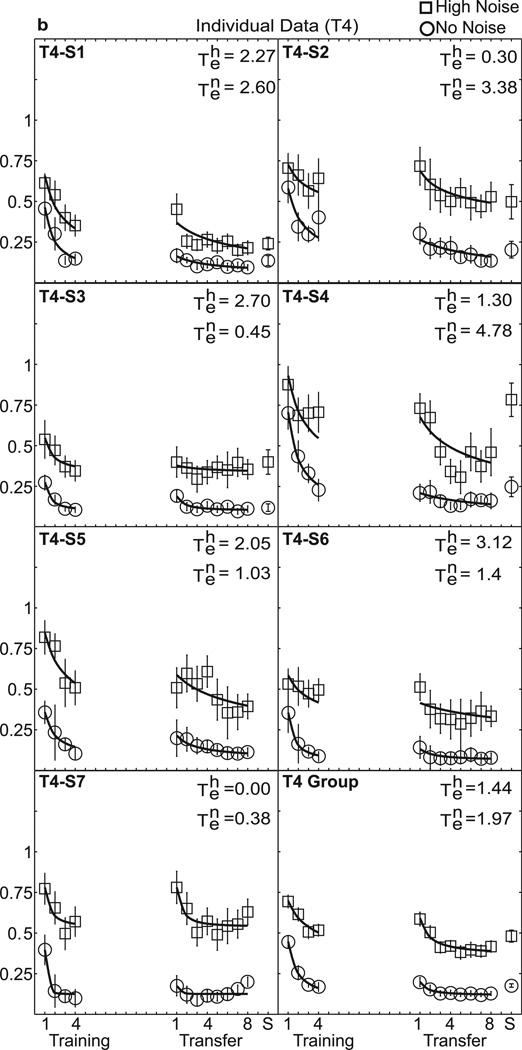
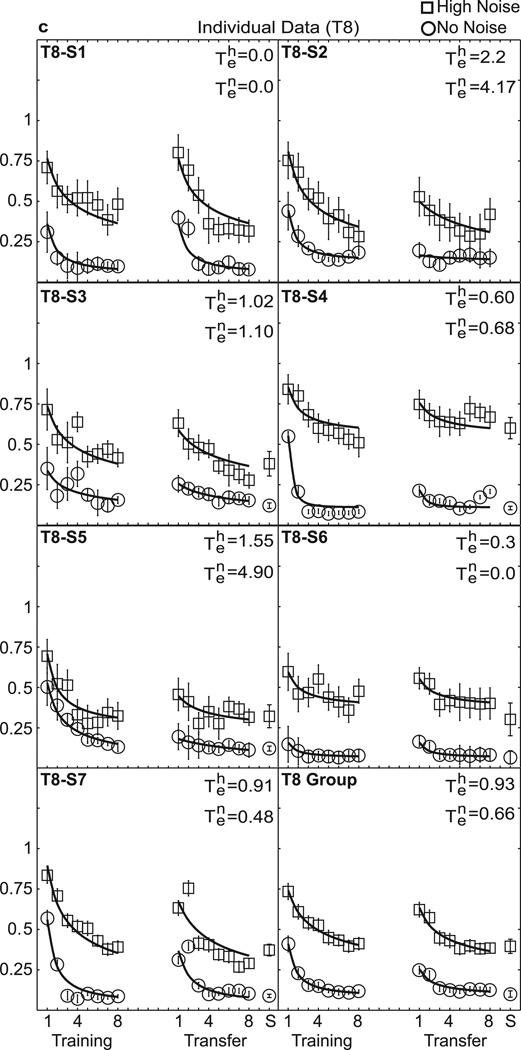
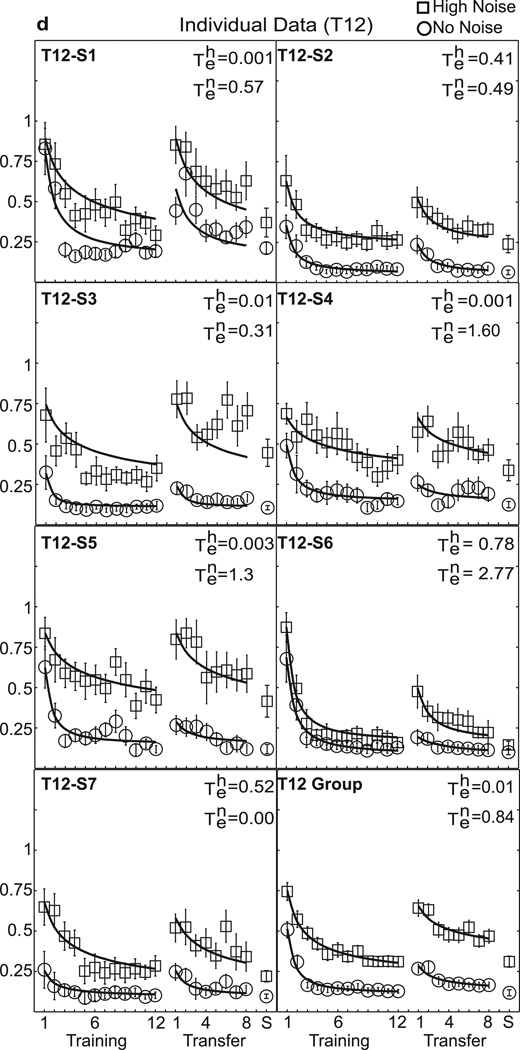
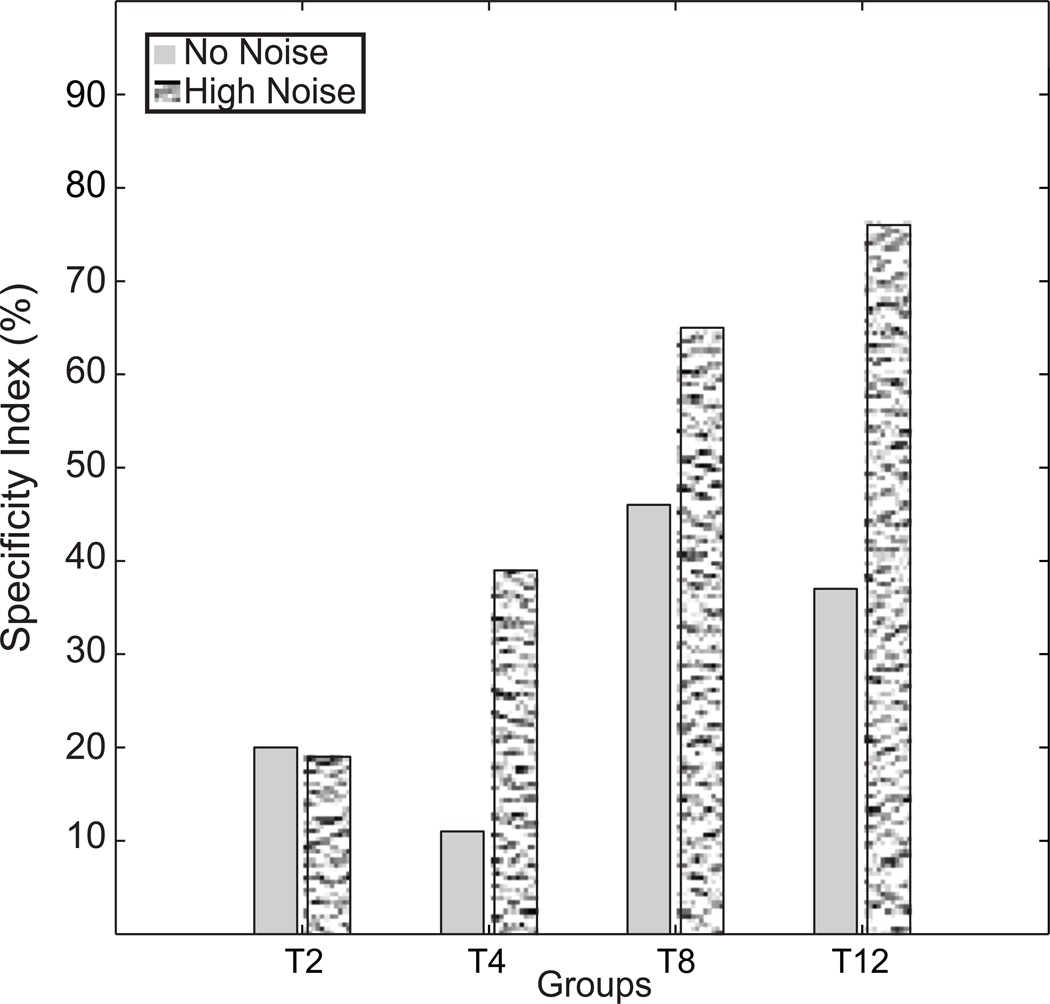
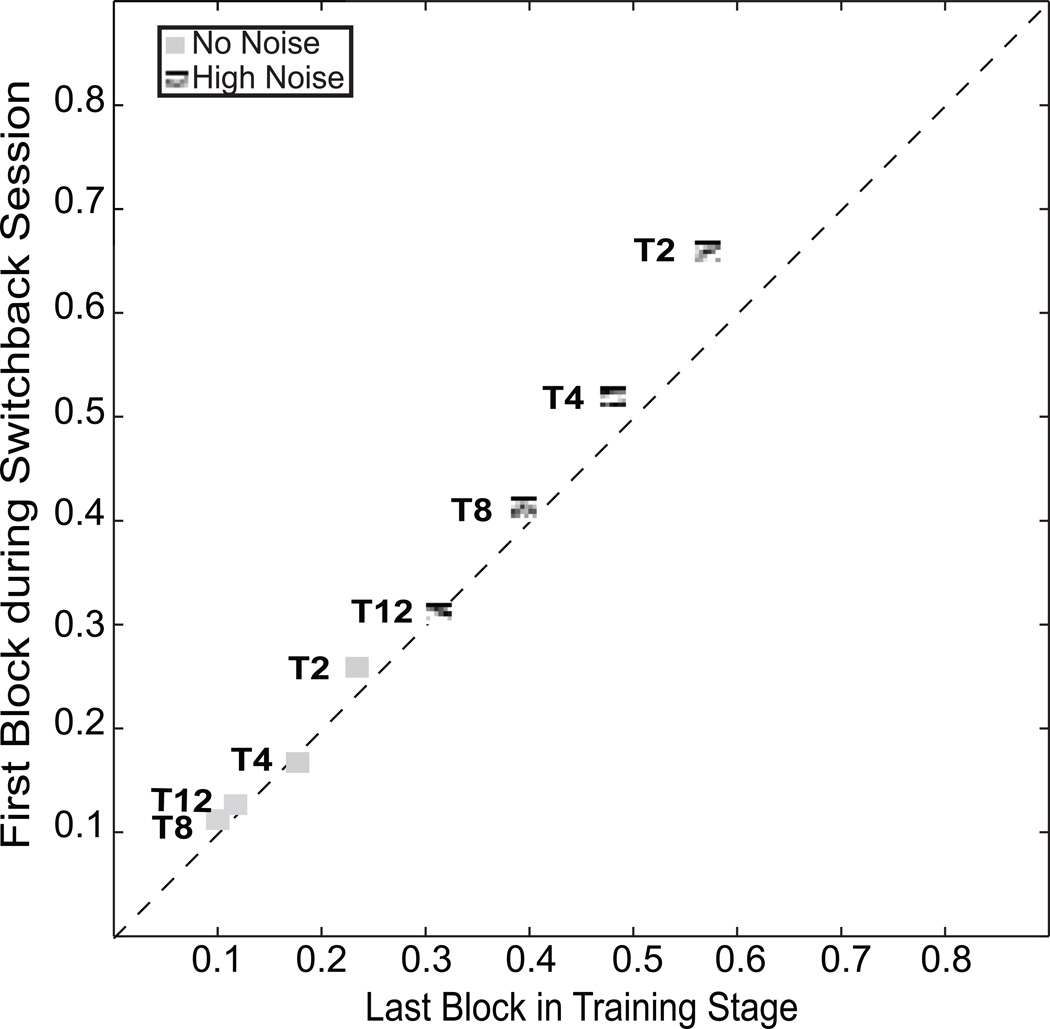
Perceptual learning often shows substantial and long-lasting changes in the ability to classify relevant perceptual stimuli due to practice. Specificity to trained stimuli and tasks is a key characteristic of visual perceptual learning, but little is known about whether specificity depends upon the extent of initial training. Using an orientation discrimination task, we demonstrate that specificity follows after extensive training, while the earliest stages of perceptual learning exhibit substantial transfer to a new location and an opposite orientation. Brief training shows the best performance at the point of transfer. These results for orientation-location transfer have both theoretical and practical implications for understanding perceptual expertise.


Figures

Figure 1
Figure 1
A schematic illustration shows full specificity (top), partial transfer/partial specificity (middle) or full transfer (bottom). Black lines show hypothetical improvements in a threshold performance measure with perceptual learning, with the learning curves on the left for initial training, and the learning curves on the right for transfer phase training. Blue vertical lines mark the improvements in performance due to transfer, while red vertical lines mark the converse failure to transfer, or specificity. The transfer can also be characterized in terms of the equivalent amount of practice required to yield the performance level at the point of task switch, shown by the green lines dropped to the practice axis at the equivalent blocks of learning at the point of transfer.
Figure 2
Figure 2
Sample stimuli, display, and data. (a) Stimuli for a high-precision discrimination task are Gabor targets with and without noise tilted ±5° from an implicit reference angle (+55° shown here, or −35°). (b) Observers trained at one of two pairs on either the NW-SE or the NE-SE diagonal and reference orientation in the training stage and switched both position and orientation in the transfer stage. (c) Average contrast thresholds (75%) during initial training and subsequent practice in the transfer task are shown for conditions trained for either 2, 4, 8, or 12 blocks, in zero noise or in high external noise. High noise trials require higher contrast thresholds than no noise trials. (Black: Train 2 Blocks (T2), Yellow: Train 4 Blocks (T4), Purple: Train 8 Blocks (T8), Green: Train 12 Blocks (T12)). All groups practiced for an additional 8 blocks in the transfer stage, after switching both positions and angles. The switchback session returned to the original testing conditions. Error bars are two standard deviations estimated using Monte Carlo simulations that resampled from each subject based on the mean and standard deviations of staircase reversals, and averaged over subjects at each data point (re-sampled 1000 times).
Figure 3
Figure 3
Perceptual learning data in high and no noise for individual data and the group average. Contrast thresholds are plotted for the seven individuals in each group and the group average data: (a) T2, (b) T4, (c) T8, and (d) T12. The smooth curves are the best-fitting power function model with experience, or transfer parameter, te, free to vary shown in Table 1. See the text and Table 2 for comparisons with other nested models.
Figure 3
Figure 3
Perceptual learning data in high and no noise for individual data and the group average. Contrast thresholds are plotted for the seven individuals in each group and the group average data: (a) T2, (b) T4, (c) T8, and (d) T12. The smooth curves are the best-fitting power function model with experience, or transfer parameter, te, free to vary shown in Table 1. See the text and Table 2 for comparisons with other nested models.
Figure 4
Figure 4
Specificity Index for aggregate data in high and no external noise. The specificity index Sc=(CT1iCTend+1i)/(CX1iCTend+1i) takes into account the rapid improvements in early learning for short training groups. The index is shown for high external noise (pixilated) and no external noise (gray) test conditions. Specificity systematically increases with the amount of training, and is larger in external noise tests.
Figure 5
Figure 5
Analysis of switch-back performance. The contrast threshold for a switchback test following training in the transfer task is compared to the last contrast threshold of the same task in the initial training phase. The two are nearly equivalent, except for T2, which shows additional learning.

References

    1. Ahissar M, Hochstein S. Task difficulty and the specificity of perceptual learning. Nature. 1997;387(6631):401–406. - PubMed
    1. Ahissar M, Hochstein S. The reverse hierarchy theory of visual perceptual learning. Trends in Cognitive Sciences. 2004;8(10):457–464. - PubMed
    1. Beard BL, Levi DM, Reich LN. Perceptual-Learning in Parafoveal Vision. Vision Research. 1995;35(12):1679–1690. - PubMed
    1. Brainard DH. The psychophysics toolbox. Spatial Vision. 1997;10(4):433–436. - PubMed
    1. Censor N, Sagi D. Global resistance to local perceptual adaptation in texture discrimination. Vision Research. 2009;49:2550–2556. - PubMed

Publication types

MeSH terms