

Relaxed purifying selection and possibly high rate of adaptation in primate lineage-specific genes
- PMID: 20624743
- PMCID: PMC2997544
- DOI: 10.1093/gbe/evq019
Relaxed purifying selection and possibly high rate of adaptation in primate lineage-specific genes
Abstract
Genes in the same organism vary in the time since their evolutionary origin. Without horizontal gene transfer, young genes are necessarily restricted to a few closely related species, whereas old genes can be broadly distributed across the phylogeny. It has been shown that young genes evolve faster than old genes; however, the evolutionary forces responsible for this pattern remain obscure. Here, we classify human-chimp protein-coding genes into different age classes, according to the breath of their phylogenetic distribution. We estimate the strength of purifying selection and the rate of adaptive selection for genes in different age classes. We find that older genes carry fewer and less frequent nonsynonymous single-nucleotide polymorphisms than younger genes suggesting that older genes experience a stronger purifying selection at the protein-coding level. We infer the distribution of fitness effects of new deleterious mutations and find that older genes have proportionally more slightly deleterious mutations and fewer nearly neutral mutations than younger genes. To investigate the role of adaptive selection of genes in different age classes, we determine the selection coefficient (gamma = 2N(e)s) of genes using the MKPRF approach and estimate the ratio of the rate of adaptive nonsynonymous substitution to synonymous substitution (omega(A)) using the DoFE method. Although the proportion of positively selected genes (gamma > 0) is significantly higher in younger genes, we find no correlation between omega(A) and gene age. Collectively, these results provide strong evidence that younger genes are subject to weaker purifying selection and more tenuous evidence that they also undergo adaptive evolution more frequently.
Figures
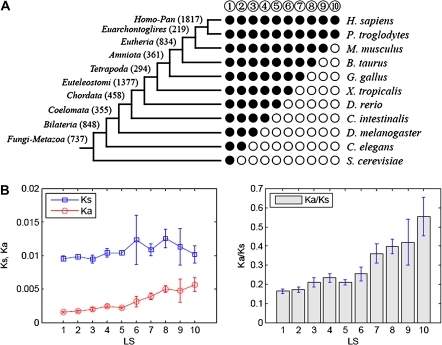
 and open circles
  indicate the presence and absence of human genes in the corresponding species, respectively. Genes that are present in all 11 species (i.e., LS 1 genes) show the profile like
  (vertically arranged); genes that are present in human and chimpanzee and absent in the rest species (i.e., LS 10 genes) have the profile like
  (vertically arranged). LS levels are labeled with circled numbers. Genes whose phylogenetic profiles do not match any of the ten given profiles were excluded from the analysis; otherwise, they (such as, those with a profile like
  ) were excluded from the analysis. The numbers of genes in LS groups are given in the parentheses. (B) Medians of divergence rates (pooled Ka, KS, and Ka/KS derived from the Applera divergence data [Bustamante et al. 2005]) for ten LS groups. Error bars indicate 95% CIs calculated from the 10,000 bootstrap replications. For individual genes, the Ka and Ka/KS values vary widely and significantly among different LS groups (χ2 = 2024.91 and 1926.15, respectively, degrees of freedom [df] = 9, P << 0.001 in both cases, KW test). The difference in KS is much less substantial albeit significant among LS groups (χ2 = 39.17, df = 9, P = 1.07 × 10⁻⁵, KW test). Ka and Ka/KS are positively correlated with the LS values (Spearman’s ρ = 0.507 and 0.503, respectively, P << 0.001 in both cases), whereas Ks shows no such correlation (Spearman’s ρ = 0.016, P = 0.182).
References
-
- Alba MM, Castresana J. Inverse relationship between evolutionary rate and age of mammalian genes. Mol Biol Evol. 2005;22:598–606. - PubMed
-
- Al-Shahrour F, Diaz-Uriarte R, Dopazo J. FatiGO: a web tool for finding significant associations of Gene Ontology terms with groups of genes. Bioinformatics. 2004;20:578–580. - PubMed
