Comparative Study
. 2010 Jul 12:2:425-40.
doi: 10.1093/gbe/evq030.

Ecdysozoan mitogenomics: evidence for a common origin of the legged invertebrates, the Panarthropoda

Affiliations
Comparative Study

Ecdysozoan mitogenomics: evidence for a common origin of the legged invertebrates, the Panarthropoda

Omar Rota-Stabelli et al. Genome Biol Evol. .

Abstract

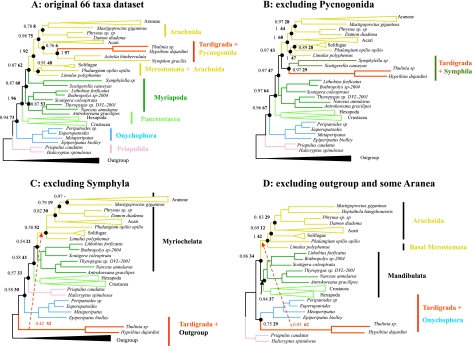
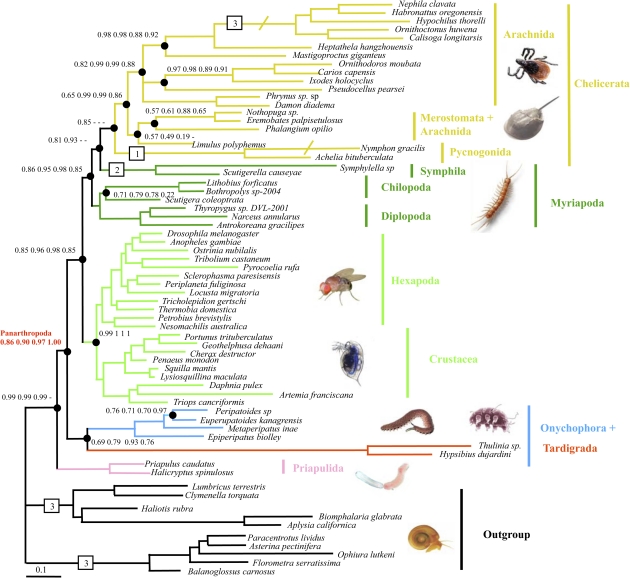
Ecdysozoa is the recently recognized clade of molting animals that comprises the vast majority of extant animal species and the most important invertebrate model organisms--the fruit fly and the nematode worm. Evolutionary relationships within the ecdysozoans remain, however, unresolved, impairing the correct interpretation of comparative genomic studies. In particular, the affinities of the three Panarthropoda phyla (Arthropoda, Onychophora, and Tardigrada) and the position of Myriapoda within Arthropoda (Mandibulata vs. Myriochelata hypothesis) are among the most contentious issues in animal phylogenetics. To elucidate these relationships, we have determined and analyzed complete or nearly complete mitochondrial genome sequences of two Tardigrada, Hypsibius dujardini and Thulinia sp. (the first genomes to date for this phylum); one Priapulida, Halicryptus spinulosus; and two Onychophora, Peripatoides sp. and Epiperipatus biolleyi; and a partial mitochondrial genome sequence of the Onychophora Euperipatoides kanagrensis. Tardigrada mitochondrial genomes resemble those of the arthropods in term of the gene order and strand asymmetry, whereas Onychophora genomes are characterized by numerous gene order rearrangements and strand asymmetry variations. In addition, Onychophora genomes are extremely enriched in A and T nucleotides, whereas Priapulida and Tardigrada are more balanced. Phylogenetic analyses based on concatenated amino acid coding sequences support a monophyletic origin of the Ecdysozoa and the position of Priapulida as the sister group of a monophyletic Panarthropoda (Tardigrada plus Onychophora plus Arthropoda). The position of Tardigrada is more problematic, most likely because of long branch attraction (LBA). However, experiments designed to reduce LBA suggest that the most likely placement of Tardigrada is as a sister group of Onychophora. The same analyses also recover monophyly of traditionally recognized arthropod lineages such as Arachnida and of the highly debated clade Mandibulata.


Figures

F<sc>IG</sc>. 1.—
FIG. 1.—
—Compositional properties of ecdysozoan mitochondrial coding sequences. The G + C content of 1st and 2nd codon positions in the concatenated alignment is plotted against the percentage of amino acids encoded by G- and C-rich codons (glycine, alanine, arginine, and proline [G + A + R + P]). Values are averaged for some major groups, with SDs indicated. All Ecdysozoa are A + T rich compared with outgroup sequences. Onychophora are extremely A + T rich, whereas Priapulida and Tardigrada have more balanced nucleotide compositions. Amino acid frequencies are more homogenous within groups than are the corresponding nucleotide frequencies. As a matter of comparison, we have plotted the expected amino acid composition (white squares and dotted regression line) for randomized nucleotide sequences. Color code is the same as in other figures.
F<sc>IG</sc>. 2.—
FIG. 2.—
—Mitochondrial gene order in Arthropoda, Tardigrada, Onychophora, and Priapulida. Mitochondrial gene order comparisons are shown for sampled Onychophora, Priapulida, and Tardigrada and the AAGO (exemplified by Limulus polyphemus). tRNAs are labeled by the one-letter code for their corresponding amino acids. Genes are transcribed from left to right unless underlined. Black arrows indicate inferred genome rearrangements. Red arrows show inferred synapomorphies of each of the two phyla Priapulida and Tardigrada. Multiple tRNA gene rearrangements inferred between Peripatoides sp. and the two other onychophoran species have been omitted for clarity.
F<sc>IG</sc>. 3.—
FIG. 3.—
—Strand compositional asymmetry in Priapulida, Tardigrada, and Onychophora. GC skew calculated for 1st plus 2nd (on the left) and 3rd (on the right) codon positions for the 13 protein-coding genes of Tardigrada (A), Onychophora (B), and Priapulida (C). Genes are ordered as in the AAGO, and for each plot, the values for Limulus polyphemus are given. Genes are named as following: N2 (nad2), C1 (cox1), C2 (cox2) A6 (atp6), C3 (cox3), N3 (nad3), N5 (nad5), N4 (nad4), NL (nad4L), N6 (nad6), CB (cytb), and N1 (nad1).
F<sc>IG</sc>. 4.—
FIG. 4.—
—Phylogenetic analyses of nucleotide data set support an unlikely Pycnogonida affinity of the Tardigrada. Consensus tree from the Bayesian analysis of partitioned 1st and 2nd codon positions using two distinct GTR models is shown. Support at nodes (from left to right) are the PP from the Bayesian analysis (plain text), the bootstrap supports from the ML analysis using the same model (bold), and the PP from the Bayesian analysis using the NTE recoding and model (underlined). Tardigrada is consistently recovered as closely related to rapidly evolving Pycnogonida and Symphyla. An alternative position for the Tardigrada plus Pycnogonida using ML is shown by the dotted arrow.
F<sc>IG</sc>. 5.—
FIG. 5.—
—The position of Tardigrada is sensitive to the taxa used in analysis under homogenous model. Consensus trees from the Bayesian analysis of the amino acid data set using the MtZoa model, with values at nodes being the PP from the Bayesian analysis (plain text) and the bootstrap supports from the ML analysis (bold). The original data set (tree A) was modified by sequential removal of rapidly evolving lineages: Pycnogonida (B), Symphyla (C), and outgroups plus some rapidly evolving chelicerates (D). The position of Tardigrada (in red) changes as the taxon sampling is reduced, suggesting a reiterated LBA artifact. When all rapidly evolving lineages are excluded and only slowly evolving Priapulida (in pink) are used as outgroups (tree D), support for a group of Tardigrada plus Onychophora is recovered. We show a schematic version of the Bayesian trees with some lineages collapsed for clarity. The original Bayesian tree using the full data set can be inspected in supplementary figure 2 (Supplementary Material online). An alternative position for the Tardigrada using ML is shown by the dotted arrow. Color code is the same as in other figures.
F<sc>IG</sc>. 6.—
FIG. 6.—
—Consistent support for Tardigrada plus Onychophora following sequential taxon removal under the CAT model. Consensus tree from the Bayesian analysis of the amino acid data set using the heterogeneous CAT model is shown. Rapidly evolving lineages were sequentially removed from the original data set as in figure 5. The four analyses resulted in similar topologies and consistently supported a group of Tardigrada plus Onychophora. Values at nodes are PP using (from left to right) the original 66-taxa data set, and the sequential removal of Pycnogonida (branch square labeled 1), Symphyla (labeled 2), and the outgroups plus rapidly evolving Chelicerata (labeled 3). Where not indicated, PPs are 1. Angled slashes on branches indicate that branch length has been halved.
F<sc>IG</sc>. 7.—
FIG. 7.—
—Signal decomposition supports Mandibulata and Panarthropoda. Consensus tree from the CAT Bayesian analysis of (A) sites with slow and fast evolutionary rates (corresponding to 1st and 4th quartiles of a slow–fast distribution) and (B) the sites with moderate evolutionary rates (corresponding to 2nd and 3rd quartiles). Supports at nodes are PPs.

References

    1. Abascal F, Posada D, Zardoya R. MtArt: a new model of amino acid replacement for Arthropoda. Mol Biol Evol. 2007;24:1–5. - PubMed
    1. Adachi J, Hasegawa M. Model of amino acid substitution in proteins encoded by mitochondrial DNA. J Mol Evol. 1996;42:459–468. - PubMed
    1. Aguinaldo AM, et al. Evidence for a clade of nematodes, arthropods, and other moulting animals. Nature. 1997;387:489–493. - PubMed
    1. Blanquart S, Lartillot N. A site- and time-heterogeneous model of amino acid replacement. Mol Biol Evol. 2008;25:842–858. - PubMed
    1. Boore JL, Lavrov DV, Brown WM. Gene translocation links insects and crustaceans. Nature. 1998;392:667–668. - PubMed

Publication types

MeSH terms

Substances