. 2011 Jan;12(1):33-50.
doi: 10.1093/biostatistics/kxq043. Epub 2010 Jul 12.

A multilevel model to address batch effects in copy number estimation using SNP arrays

Affiliations

A multilevel model to address batch effects in copy number estimation using SNP arrays

Robert B Scharpf et al. Biostatistics. 2011 Jan.

Abstract

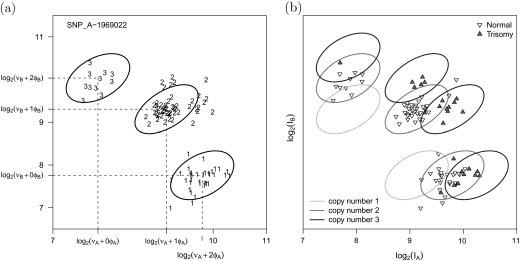
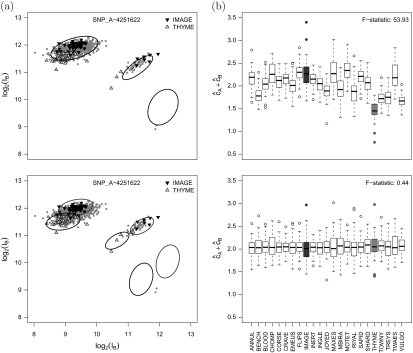
Submicroscopic changes in chromosomal DNA copy number dosage are common and have been implicated in many heritable diseases and cancers. Recent high-throughput technologies have a resolution that permits the detection of segmental changes in DNA copy number that span thousands of base pairs in the genome. Genomewide association studies (GWAS) may simultaneously screen for copy number phenotype and single nucleotide polymorphism (SNP) phenotype associations as part of the analytic strategy. However, genomewide array analyses are particularly susceptible to batch effects as the logistics of preparing DNA and processing thousands of arrays often involves multiple laboratories and technicians, or changes over calendar time to the reagents and laboratory equipment. Failure to adjust for batch effects can lead to incorrect inference and requires inefficient post hoc quality control procedures to exclude regions that are associated with batch. Our work extends previous model-based approaches for copy number estimation by explicitly modeling batch and using shrinkage to improve locus-specific estimates of copy number uncertainty. Key features of this approach include the use of biallelic genotype calls from experimental data to estimate batch-specific and locus-specific parameters of background and signal without the requirement of training data. We illustrate these ideas using a study of bipolar disease and a study of chromosome 21 trisomy. The former has batch effects that dominate much of the observed variation in the quantile-normalized intensities, while the latter illustrates the robustness of our approach to a data set in which approximately 27% of the samples have altered copy number. Locus-specific estimates of copy number can be plotted on the copy number scale to investigate mosaicism and guide the choice of appropriate downstream approaches for smoothing the copy number as a function of physical position. The software is open source and implemented in the R package crlmm at Bioconductor (http:www.bioconductor.org).


Figures

Fig 1.
Fig 1.
The European ancestry controls for bipolar disease were run on 29 plates; we excluded 6 plates that had fewer than 20 samples after removing duplicates and samples with low quality (signal to noise ratio less than 5). (a) Scatter plots of the quantile normalized intensities of the A (x-axis) and B (y-axis) alleles for SNP_A-4251622. Highlighted in the scatter plots are the samples from the plates IMAGE and THYME. (b) Boxplots of log2(A) + log2(B) stratified by plate. (c) For each SNP on chromosome 15, we performed an analysis of variance (ANOVA) for the quantile normalized log2(A) + log2(B) intensities by plate. After excluding 5 plates with fewer than 20 samples, the ANOVA provides an F-statistic with 22 and 984 degrees of freedom for each of the 26,074 SNPs on chromosome 15.
Fig 2.
Fig 2.
Scatterplots of the A and B allele intensities for SNP_A-1969022 on chromosome 21 in the trisomy data set. (a) Our approach for copy number estimation uses naive estimates of allele-specific copy number based on the biallelic genotype calls. A weighted linear regression is fit on the intensity scale to quantile-based estimators of the within-genotype location and scale. Estimates of νA,νB,φA, and φB are locus and batch specific. The ellipses demarcate a 95% confidence region for copy number 2. (b) Prediction regions for copy number 1, 2, and 3. Plotting symbols now denote the trisomy phenotype which is not known by the regression model. Note that the prediction regions are robust to incorrect biallelic genotype calls —here, 26 of the 96 subjects had chromosome 21 trisomy and, therefore, incorrect biallelic genotypes.
Fig 3.
Fig 3.
(a–c) The ellipses denote prediction regions for copy number 1, 2, and 3 before (dashed lines) and after (solid lines) bias adjustment for 3 SNPs on chromosome 21 in the Chakravarti data set. Boxplots of the copy number estimates for SNPs on chromosome 21 before (d) and after (e) the bias correction for common copy number variant. The bias correction does not use any phenotypic information of the samples, nor does it require a priori specification of regions that are thought to harbor common copy number variants. The circle plotting symbols denote the overall copy number estimate from Birdseye.
Fig 4.
Fig 4.
(a) Scatter plots of the quantile normalized intensities for the A (x-axis) and B (y-axis) alleles of SNP_A-4251622 in the bipolar data set. Highlighted in each panel are the samples from plates IMAGE and THYME. Note that much of the variance in the normalized intensities is explained by batch. (b) Boxplots of total copy number before (top) and after adjustment for plate (bottom). A multilevel model that allows the prediction regions to depend on plate improves estimates and removes batch-driven artifacts.

References

    1. Autism Genome Project Consortium. “Mapping autism risk loci using genetic linkage and chromosomal rearrangements.”. Nature Genetics. 2007;39:319–328. - PMC - PubMed
    1. Beroukhim R, Getz G, Nghiemphu L, Barretina J, Hsueh T, Linhart D, Vivanco I, Lee JC, Huang JH, Alexander S others. Assessing the significance of chromosomal aberrations in cancer: Methodology and application to glioma. Proceedings of the National Academy of Sciences of the United States of America. 2007;104:20007–20012. - PMC - PubMed
    1. Cappuzzo F, Marchetti A, Skokan M, Rossi E, Gajapathy S, Felicioni L, Grammastro MD, Sciarrotta MG, Buttitta F, Incarbone M others. Increased MET gene copy number negatively affects survival of surgically resected non-small-cell lung cancer patients. Journal of Clinical Oncology. 2009;27:1667–1674. - PMC - PubMed
    1. Carvalho BS, Louis TA, Irizarry RA. “Quantifying uncertainty in genotype calls.”. Bioinformatics. 2010;26(2):242–249. - PMC - PubMed
    1. Carvalho MA, Marsillac SM, Karchin R, Manoukian S, Grist S, Swaby RF, Urmenyi TP, Rondinelli E, Silva R, Gayol L others. Determination of cancer risk associated with germ line BRCA1 missense variants by functional analysis. Cancer Research. 2007;67:1494–1501. - PMC - PubMed

Publication types