. 2010 Jul 6;8(7):e1000414.
doi: 10.1371/journal.pbio.1000414.

The role of nucleosome positioning in the evolution of gene regulation

Affiliations

The role of nucleosome positioning in the evolution of gene regulation

Alexander M Tsankov et al. PLoS Biol. .

Abstract

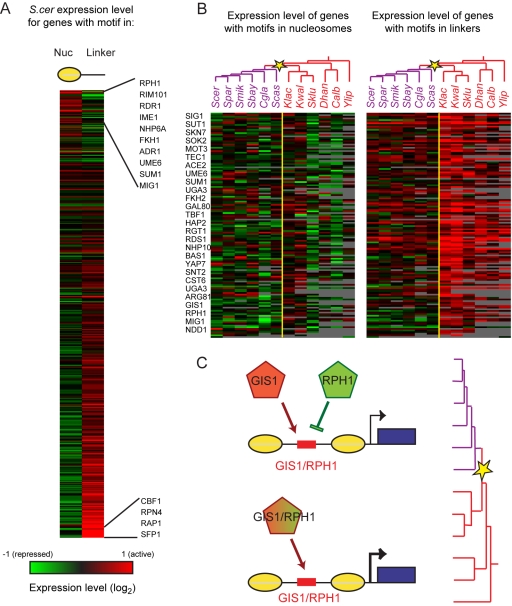
Chromatin organization plays a major role in gene regulation and can affect the function and evolution of new transcriptional programs. However, it can be difficult to decipher the basis of changes in chromatin organization and their functional effect on gene expression. Here, we present a large-scale comparative genomic analysis of the relationship between chromatin organization and gene expression, by measuring mRNA abundance and nucleosome positions genome-wide in 12 Hemiascomycota yeast species. We found substantial conservation of global and functional chromatin organization in all species, including prominent nucleosome-free regions (NFRs) at gene promoters, and distinct chromatin architecture in growth and stress genes. Chromatin organization has also substantially diverged in both global quantitative features, such as spacing between adjacent nucleosomes, and in functional groups of genes. Expression levels, intrinsic anti-nucleosomal sequences, and trans-acting chromatin modifiers all play important, complementary, and evolvable roles in determining NFRs. We identify five mechanisms that couple chromatin organization to evolution of gene regulation and have contributed to the evolution of respiro-fermentation and other key systems, including (1) compensatory evolution of alternative modifiers associated with conserved chromatin organization, (2) a gradual transition from constitutive to trans-regulated NFRs, (3) a loss of intrinsic anti-nucleosomal sequences accompanying changes in chromatin organization and gene expression, (4) re-positioning of motifs from NFRs to nucleosome-occluded regions, and (5) the expanded use of NFRs by paralogous activator-repressor pairs. Our study sheds light on the molecular basis of chromatin organization, and on the role of chromatin organization in the evolution of gene regulation.


Conflict of interest statement

The authors have declared that no competing interests exist.

Figures

Figure 1
Figure 1. Global chromatin organization in 12 Hemiascomycota fungi.
(A) Phylogeny of species included in this study (adapted from [34]). Right, gene-averaged nucleosome sequencing data from 4 of the 12 species, aligned by Nuc+1. (Data for all species are in Figure S2.) (B) Chromatin features. Shown is a schematic of a gene (green box), its promoter (black line) and associated nucleosomes (yellow), along with nucleosome sequencing data (dark blue curve), and several extracted features, as indicated. (C) Global variation between species in nucleosome spacing in coding regions. Shown are the median nucleosome-to-nucleosome distances over coding regions, averaged over all genes in each species. Values are arranged from low to high rather than by phylogeny to emphasize the range of variability. Species names are colored by their relation to WGD as in (A). (D) Spacing differences between two Kluyveromyces species. Shown are 5′ NFR-aligned averaged data for K. lactis (red) and K. waltii (blue), showing differences in coding region spacing. (E) Global variation in NFR to ATG distance (D5′NFR-ATG). Shown are median distances from the 5′ NFR to start codon for all genes in each species, sorted from low to high values. (F) Distribution of NFR to ATG distances (D5′NFR-ATG) in S. kluyverii (blue) and C. glabrata (red).
Figure 2
Figure 2. Conservation and variation in chromatin structure of functional gene sets.
(A,B). Strategy for associating chromatin features with gene sets. (A) Shown is Nuc+1-aligned nucleosome data for all genes (blue) and ribosomal protein genes (red) in S. cerevisiae, demonstrating that ribosomal protein genes are associated with wider NFRs. (B) Cumulative distribution plot of NFR occupancy in all genes (blue) versus ribosomal protein genes (red). y-axis shows fraction of promoters with NFR occupancy below a given value, with NFR occupancy values on the x-axis. Wide separation between curves (light blue vertical line) is captured by a significant K-S statistic, indicating that ribosomal genes have significantly low occupancy, or “deep” NFRs. K-S P values are converted to color scale (right panel): blue, significantly low feature values; yellow, significantly high feature values. (C–J) Conservation and variation in chromatin organization in specific gene sets. Shown are the K-S statistics for expression level (red, high expression; green, low expression; left panel), NFR occupancy (yellow/blue, middle panel), and Poly(dA:dT) tracts in NFRs (purple, high Poly(dA:dT) strength enrichment; dark blue, low strength enrichment; right panel) for gene sets (rows) with distinct phylogenetic patterns across the 12 species (columns; species names are color coded by WGD). K-S P values at saturation are 10−20 (Expression, C–E), 10−5 (occupancy and PolyA, C–E), 10−10 (Expression, F–G), 10−2.5 (occupancy and PolyA F–G). For (H–J), all gene sets are normalized to an average row value of zero (i.e., centered to show relative changes), and P value saturation values are 10−8 (expression) and 10−2 (occupancy, PolyA). Also shown are cartoons (right) reflecting the chromatin organization inferred from the test and relevant phylogenetic events. (C) Conserved deep NFRs in growth genes, associated with high expression and strong Poly(dA:dT) tracts; (D) conserved occupied NFRs in stress genes, associated with low expression and weak Poly(dA:dT) tracts; (E) conserved deep NFRs in proteasome genes associated with high expression but not with Poly(dA:dT) tracts; (F) conserved occupied NFRs in glycolysis genes despite high expression; (G) deep NFRs and high expression at nuclear pore genes associated with Poly(dA:dT) tracts only in a subset of species; (H) divergence from deep to occupied NFRs following the WGD at mitochondrial protein genes, associated with reduction in expression and in Poly(dA:dT) tracts; (I) divergence from occupied to deep NFRs following the WGD in cytoskeletal genes, despite little change in expression or Poly(dA:dT) tracts; (J) divergence from deep to occupied NFRs in splicing after the divergence of Y. lipolytica associated with reduction in expression and in poly dA:dT tracts.
Figure 3
Figure 3. Evolution of sequence motifs associated with nucleosome depletion.
(A) Identification of putative GRF sites. Nucleosome depletion scores were calculated over all 7-mers from in vitro reconstitution data and from our in vivo data for all species (Materials and Methods). Scatter plot shows the in vitro depletion score (x-axis) versus the maximal 7-mer nucleosome depletion score observed in vivo in any of the 12 species (y-axis). Motifs corresponding to select known binding sites are indicated. (B) Evolutionary transition from the GRF Cbf1 to the GRF Reb1 through a redundant intermediate. Shown are the nucleosome depletion scores for the Cbf1 (blue) and Reb1 (orange) sites for the in vivo data from the 12 species (purple, red species as in Figure 1A), and for two published in vitro reconstitution datasets (blue) in S. cerevisiae (left) and C. albicans (right) . Bottom, phylogenetic tree marked with inferred events including the ancestral role of Cbf1 (blue bar), the gain of Reb1 (orange bar) and the loss of Cbf1's and Reb1's role as GRFs (lightning bolts). (C–E) Schematics of the evolution of usage of GRF and intrinsic anti-nucleosomal sites in proteasome genes (C), RNA polymerase genes (D), and peroxisome genes (E). Yellow ovals, nucleosomes; blue box, coding sequence; arrow, promoter; polyA, intrinsic anti-nucleosomal sequences; Abf1, Rsc, Reb1, CACGAC (C.albicans-specific GRF site), enriched GRF motifs. The phylogenetic tree is shown on the right, with the relevant clades in colors matching to the highlighted species. Bar, gain of functional site; lightning bolt, loss of functional site.
Figure 4
Figure 4. Evolutionary re-positioning of TF motif sites relative to nucleosomes.
(A) Motif site location relative to chromatin features in S. cerevisiae. Shown are distributions of locations of the indicated TF binding sites (red), relative to the averaged chromatin profile for genes bearing instances of these sites (blue) in S. cerevisiae. (B) Fraction of TF binding sites located in the NFR in S. cerevisiae was calculated for 435 motifs, and TFs are arranged from NFR-depleted (top) to NFR-enriched (bottom). Red arrows point to TFs displayed in (A). (C) Location of TF binding sites relative to NFRs in all 12 species. Blue, NFR depleted; yellow, NFR enriched. Since the fraction of sites in NFRs varies with average NFR width and phylogenetic distance from S. cerevisiae, the fraction of motif instances located in NFR for each species was normalized by each species' mean and standard deviation. White, S. cerevisiae motifs for TFs whose orthologs are absent from a given species. (D) Motif repositioning at the WGD. Shown are the most significantly repositioned motifs between pre- and post-WGD species (t-test) from NFRs to nucleosomes (top) and vice versa (bottom). Star, WGD. Blue, NFR depleted; yellow, NFR enriched; values were first normalized as in panel A, and then each row was mean-normalized for visual emphasis. (E,F) Repositioning of TF binding sites relative to NFRs in C. glabrata meiosis and mating genes. (E) Top panel: Fraction of STE12 sites in NFRs genome-wide (blue) or at pheromone-response genes (red) for species where STE12 motif instances are enriched upstream of this gene set (P<10−3, Hypergeometric test). Bottom panel: Nucleosome data and STE12 sites location shown as in (A) for pheromone response genes in S. castellii and C. glabrata. (F) Distributions of locations of the UME6 binding site (red), relative to the averaged chromatin profile for genes bearing instances of these sites (blue) in S. castellii and C. glabrata.
Figure 5
Figure 5. Evolution of transcription factor activity is reflected in divergence of activity of NFR-localized binding sites.
(A) Nucleosome positions can be used to infer the positive or negative role of TFs in transcriptional control in S. cerevisiae. Average expression (mRNA abundance) of all genes with a given motif instance located in promoter nucleosomes (left) or NFRs (right). TFs are ordered by expression difference between NFR and nucleosomal binding sites, revealing transcriptional activators (bottom) and repressors (top) known to be active in these growth conditions. (B) Chromatin information reveals repressors associated with post-WGD nutrient control. For each species (columns) and each motif (rows), shown are mean expression levels of genes with the motif in nucleosomes (left matrix) or in linkers (right matrix). Shown are only the 138 motifs with increased activity in pre-WGD species [a correlation of over 0.5 to the vector (0,0,0,0,0,0,1,1,1,1,1,1)]. A small number of motifs were associated with higher activity in post-WGD species (unpublished data). Yellow star, WGD. (C) A model of increased regulatory capacity. Pre-WGD, only an single (activator-like) TF was present (GIS1/RPH1, bottom). Post-WGD (star), two paralogous TFs with the same sequence specificity are present in the genome (GIS1, RPH1, top), one is an activator (red), and the other a repressor (green).
Figure 6
Figure 6. An overview of the interplay between chromatin and regulatory evolution.
Shown are examples for the five key evolutionary modes discovered in the study. (A,B) Transition from “open” to “closed” NFRs associated with reduction in expression and loss of intrinsic anti-nucleosomal Poly(dA:dT) tracts in mitochondrial protein genes (at WGD) and splicing genes (after divergence of Y. lipolytica). (C) Global shift in usage of GRFs, resulting in a gradual transition from a Cbf1-dominated mechanism to a Reb1-dominated mechanism, through a redundant intermediate. (D) Compensatory evolution results in switch from constitutively programmed NFRs to GRF-regulated NFRs in RNA polymerase genes. (E–G) Re-positioning of motifs from NFRs to nucleosomes in oxidative functions following the WGD (E), and in meiosis and mating functions in C. glabrata (F,G). (H) Increased regulatory capacity at conserved NFRs and binding sites, through the duplication of trans-factors at the WGD.

References

    1. King M. C, Wilson A. C. Evolution at two levels in humans and chimpanzees. Science. 1975;188:107–116. - PubMed
    1. Thompson D. A, Regev A. Fungal regulatory evolution: cis and trans in the balance. FEBS Lett 2009 - PMC - PubMed
    1. Wohlbach D. J, Thompson D. A, Gasch A. P, Regev A. From elements to modules: regulatory evolution in Ascomycota fungi. Curr Opin Genet Dev. 2009;19:571–578. - PMC - PubMed
    1. McAdams H. H, Srinivasan B, Arkin A. P. The evolution of genetic regulatory systems in bacteria. Nat Rev Genet. 2004;5:169–178. - PubMed
    1. Gasch A. P, Moses A. M, Chiang D. Y, Fraser H. B, Berardini M, et al. Conservation and evolution of cis-regulatory systems in ascomycete fungi. PLoS Biol. 2004;2:e398. doi: 10.1371/journal.pbio.0020398. - DOI - PMC - PubMed

Publication types

MeSH terms

Associated data