

Dynamic contrast-enhanced CT in patients treated with sorafenib and erlotinib for non-small cell lung cancer: a new method of monitoring treatment?
- PMID: 20625738
- PMCID: PMC2978316
- DOI: 10.1007/s00330-010-1869-5
Dynamic contrast-enhanced CT in patients treated with sorafenib and erlotinib for non-small cell lung cancer: a new method of monitoring treatment?
Abstract
Objective: We investigated the feasibility of serial dynamic contrast-enhanced computed tomography (DCE-CT) in patients with advanced/metastatic non-small cell lung cancer (NSCLC) receiving anti-angiogenic (sorafenib) and anti-EGFR (erlotinib) treatment, and correlated tumour blood flow (BF) with treatment outcome.
Methods: DCE-CTs were performed at baseline and 3 and 6 weeks after starting treatment. Tumour BF, calculated with the maximum slope method, and percentage change were measured in 23 patients (14 male; median age 59 years). Tumour BF was compared at baseline and weeks 3 and 6; the relation with RECIST/Crabb response and progression-free survival (PFS) was assessed.
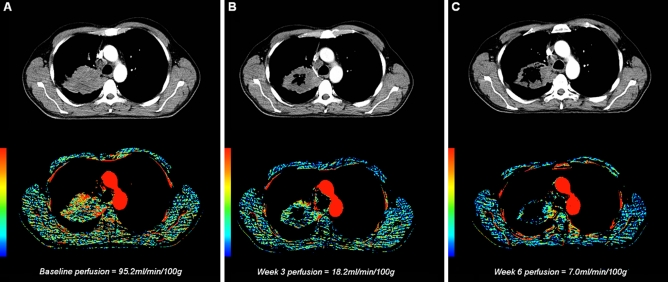
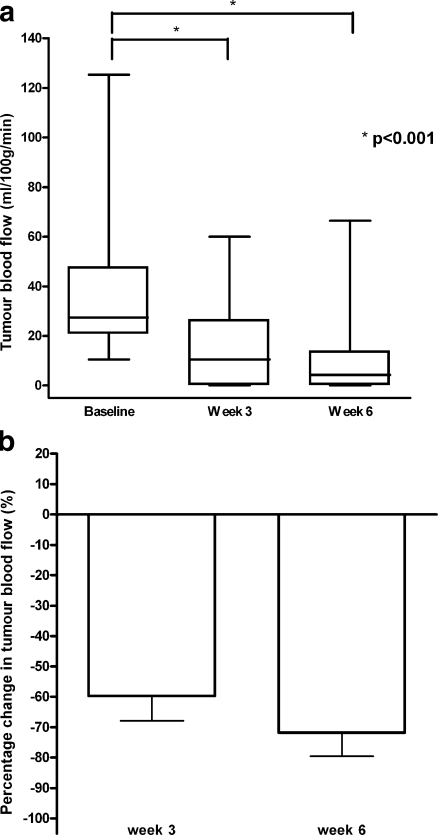
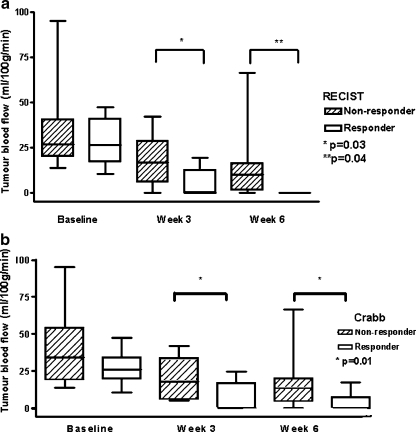
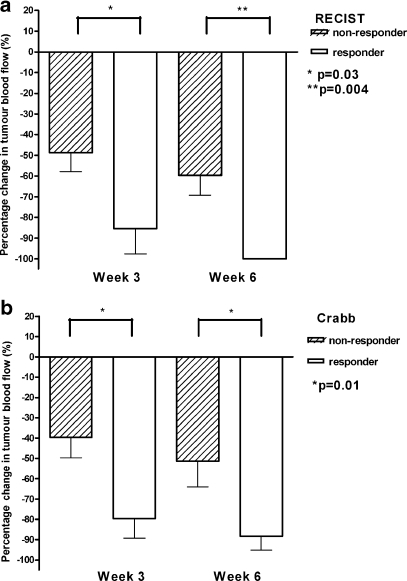
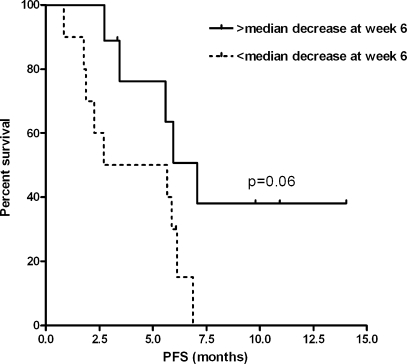
Results: Mean tumour perfusion decreased from 39.2 ml/100 g/min at baseline to 15.1 ml/100 g/min at week 3 (p < 0.001) and 9.4 ml/100 g/min at week 6 (p < 0.001). Tumour perfusion was lower in RECIST and Crabb responders versus non-responders at week 3 (4.2 versus 17.7 ml/100 g/min, p = 0.03) and week 6 (0 versus 13.4 ml/100 g/min, p = 0.04). Patients with a decrease larger than the median at week 6 tended to have a longer PFS (7.1 versus 5.7 months, p = 0.06).
Conclusion: Serial DCE-CTs are feasible in patients with NSCLC and demonstrated a significant decrease in tumour BF following sorafenib/erlotinib therapy. Early changes in tumour BF correlated with objective response and showed a trend towards longer PFS.
Figures
References
-
- Therasse P, Arbuck SG, Eisenhauer EA, Wanders J, Kaplan RS, Rubinstein L, Verweij J, Van Glabbeke M, van Oosterom AT, Christian MC, Gwyther SG. New guidelines to evaluate the response to treatment in solid tumors. European Organization for Research and Treatment of Cancer, National Cancer Institute of the United States, National Cancer Institute of Canada. J Natl Cancer Inst. 2000;92:205–216. doi: 10.1093/jnci/92.3.205. - DOI - PubMed
-
- Eisenhauer EA, Therasse P, Bogaerts J, Schwartz LH, Sargent D, Ford R, Dancey J, Arbuck S, Gwyther S, Mooney M, Rubinstein L, Shankar L, Dodd L, Kaplan R, Lacombe D, Verweij J. New response evaluation criteria in solid tumours: revised RECIST guideline (version 1.1) Eur J Cancer. 2009;45:228–247. doi: 10.1016/j.ejca.2008.10.026. - DOI - PubMed
Publication types
MeSH terms
Substances
LinkOut - more resources
Full Text Sources
Medical
Research Materials
Miscellaneous
