

Fragment-based discovery of novel thymidylate synthase leads by NMR screening and group epitope mapping
- PMID: 20626411
- PMCID: PMC2918687
- DOI: 10.1111/j.1747-0285.2010.01010.x
Fragment-based discovery of novel thymidylate synthase leads by NMR screening and group epitope mapping
Abstract
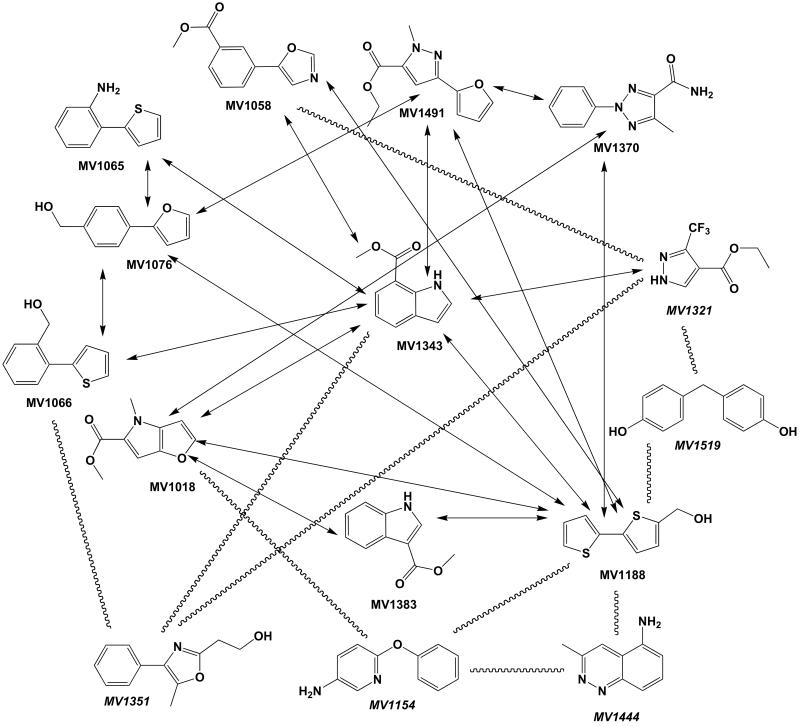
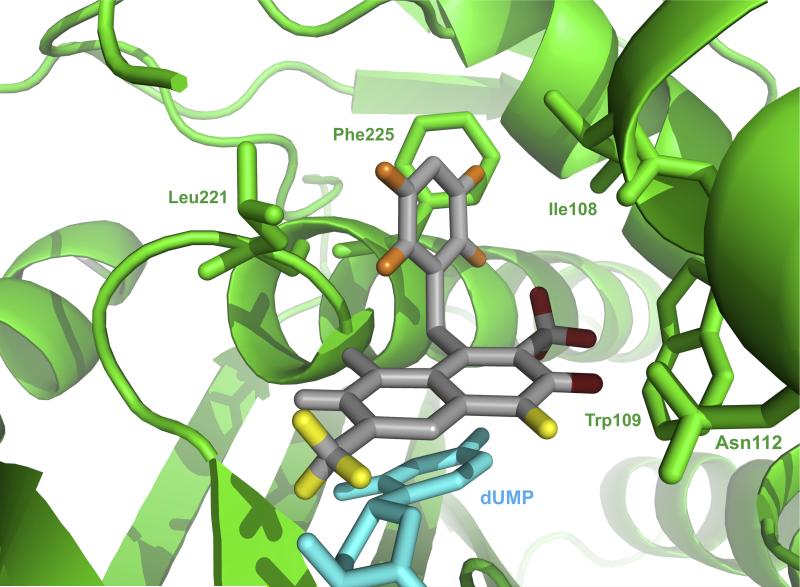
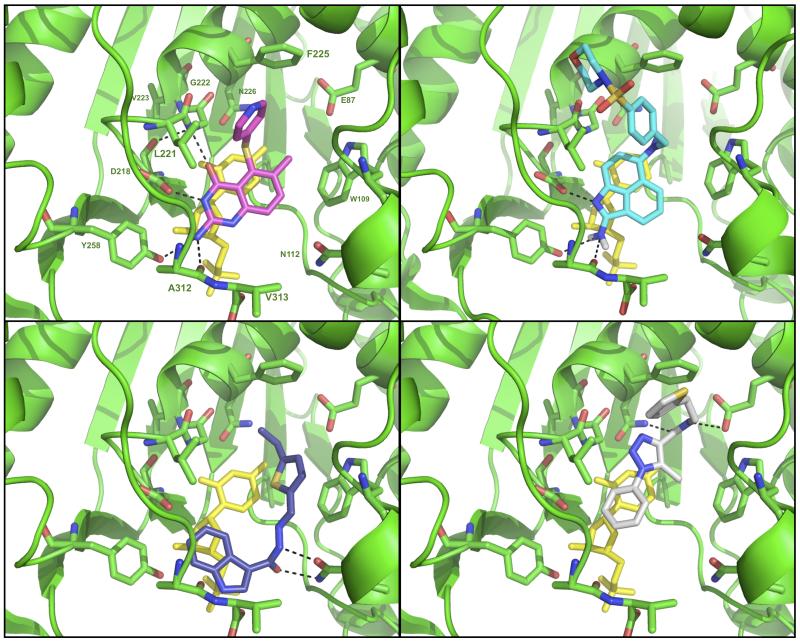
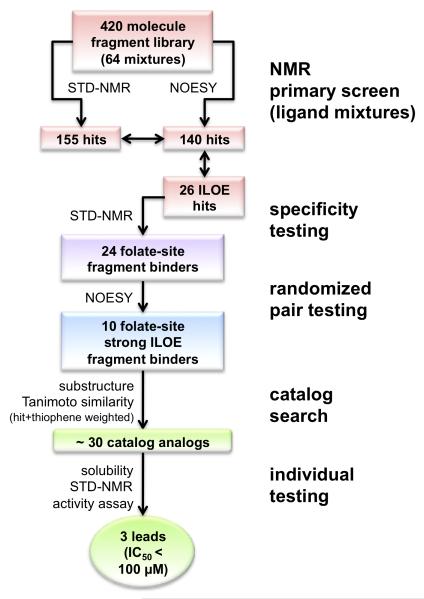
Solution-state nuclear magnetic resonance (NMR) is a versatile tool for the study of binding interactions between small molecules and macromolecular targets. We applied ligand-based NMR techniques to the study of human thymidylate synthase (hTS) using known nanomolar inhibitors and a library of small molecule fragments. Screening by NMR led to the rapid identification of ligand pairs that bind in proximal sites within the cofactor-binding pocket of hTS. Screening hits were used as search criteria within commercially available sources, and a subset of catalog analogs were tested for potency by in vitro assay and binding affinity by quantitative saturation transfer difference (STD)-NMR titration. Two compounds identified by this approach possess low micromolar affinity and potency, as well as excellent binding efficiency against hTS. Relative binding orientations for both leads were modeled using AutoDock, and the most likely bound conformations were validated using experimentally derived STD-NMR binding epitope data. These ligands represent novel starting points for fragment-based drug design of non-canonical TS inhibitors, and their binding epitopes highlight important and previously unexploited interactions with conserved residues in the cofactor-binding site.
Figures

Similar articles
-
Predicting and harnessing protein flexibility in the design of species-specific inhibitors of thymidylate synthase.Chem Biol. 2001 Oct;8(10):981-95. doi: 10.1016/s1074-5521(01)00067-9. Chem Biol. 2001. PMID: 11590022
-
Approaches to solving the rigid receptor problem by identifying a minimal set of flexible residues during ligand docking.Chem Biol. 2001 May;8(5):445-57. doi: 10.1016/s1074-5521(01)00023-0. Chem Biol. 2001. PMID: 11358692
-
Effects of ligand binding and conformational switching on intracellular stability of human thymidylate synthase.Biochim Biophys Acta. 2004 Jan 14;1696(1):15-22. doi: 10.1016/j.bbapap.2003.09.005. Biochim Biophys Acta. 2004. PMID: 14726200 Review.
-
Crystal structure of a deletion mutant of human thymidylate synthase Delta (7-29) and its ternary complex with Tomudex and dUMP.Protein Sci. 2001 May;10(5):988-96. doi: 10.1110/ps.47601. Protein Sci. 2001. PMID: 11316879 Free PMC article.
-
Human Thymidylate Synthase Inhibitors Halting Ovarian Cancer Growth.Vitam Horm. 2018;107:473-513. doi: 10.1016/bs.vh.2017.12.002. Epub 2018 Feb 12. Vitam Horm. 2018. PMID: 29544641 Review.
Cited by
-
A small-molecule probe induces a conformation in HIV TAR RNA capable of binding drug-like fragments.J Mol Biol. 2011 Jul 29;410(5):984-96. doi: 10.1016/j.jmb.2011.03.039. J Mol Biol. 2011. PMID: 21763501 Free PMC article.
-
Efficient NMR Screening Approach to Discover Small Molecule Fragments Binding Structured RNA.ACS Med Chem Lett. 2021 Jul 13;12(8):1253-1260. doi: 10.1021/acsmedchemlett.1c00109. eCollection 2021 Aug 12. ACS Med Chem Lett. 2021. PMID: 34413954 Free PMC article.
-
Leveraging structure determination with fragment screening for infectious disease drug targets: MECP synthase from Burkholderia pseudomallei.J Struct Funct Genomics. 2011 Jul;12(2):63-76. doi: 10.1007/s10969-011-9102-6. Epub 2011 Feb 26. J Struct Funct Genomics. 2011. PMID: 21359640 Free PMC article.
-
Solution NMR Spectroscopy in Target-Based Drug Discovery.Molecules. 2017 Aug 23;22(9):1399. doi: 10.3390/molecules22091399. Molecules. 2017. PMID: 28832542 Free PMC article. Review.
-
Optimising selective excitation pulses to maximise saturation transfer difference NMR spectroscopy.RSC Adv. 2014;4(14):7347-7351. doi: 10.1039/C3RA46246C. Epub 2014 Jan 8. RSC Adv. 2014. PMID: 27182436 Free PMC article.
References
-
- Carreras CW, Santi DV. The Catalytic Mechanism and Structure of Thymidylate Synthase. Annual Review of Biochemistry. 1995;64:689–719. - PubMed
-
- Friedkin M, Roberts D. Conversion of uracil deoxyriboside to thymidine of deoxyribonucleic acid. J Biol Chem. 1956 Jun;220(2):653–60. - PubMed
-
- Chen MS, Prusoff WH. Thymidine kinase from Escherichia coli. Methods Enzymol. 1978;51:354–60. - PubMed
-
- Harrap KR, Jackman AL, Newell DR, Taylor GA, Hughes LR, Calvert AH. Thymidylate synthase: A target for anticancer drug design. Advances in Enzyme Regulation. 1989;29:161–79. - PubMed
-
- Jackman AL, Calvert AH. Folate-based thymidylate synthase inhibitors as anticancer drugs. Ann Oncol. 1995 November 1;6(9):871–81. 1995. - PubMed
Publication types
MeSH terms
Substances
Grants and funding
LinkOut - more resources
Full Text Sources
Other Literature Sources
Chemical Information
Research Materials
