. 2010 Oct;115(1):23-35.
doi: 10.1111/j.1471-4159.2010.06898.x. Epub 2010 Jul 30.

Involvement of threonine 258 and serine 259 motif in amphetamine-induced norepinephrine transporter endocytosis

Affiliations

Involvement of threonine 258 and serine 259 motif in amphetamine-induced norepinephrine transporter endocytosis

Balasubramaniam Annamalai et al. J Neurochem. 2010 Oct.

Abstract

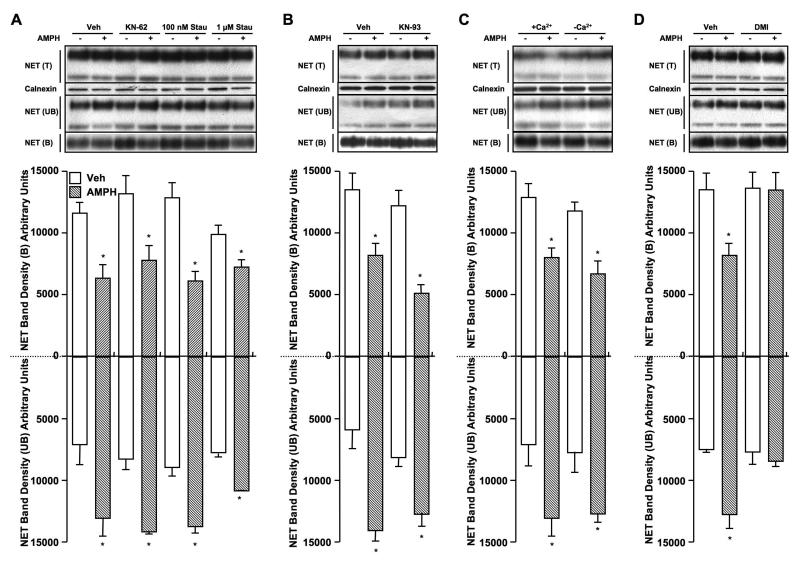
D-amphetamine (AMPH) down-regulates the norepinephrine transporter (NET), although the exact trafficking pathways altered and motifs involved are not known. Therefore, we examined the cellular and molecular mechanisms involved in AMPH-induced NET regulation in human placental trophoblast cells expressing the wild-type (WT)-hNET and the hNET double mutant (DM)-bearing protein kinase C (PKC)-resistant T258A + S259A motif. NET function and surface expression were significantly reduced in cells expressing WT-hNET but not in cells expressing hNET-DM following AMPH treatment. AMPH inhibited plasma membrane recycling of both WT-hNET and hNET-DM. In contrast, AMPH stimulated endocytosis of WT-hNET, and did not affect hNET-DM endocytosis. Although PKC or calcium/calmodulin- dependent kinase-II (CaMKII) inhibition or depletion of calcium failed to block AMPH-mediated down-regulation of WT-hNET, NET-specific blocker desipramine completely prevented AMPH-induced down-regulation. Furthermore, AMPH treatment had no effect on phospho-CaMKII immunoreactivity. The inhibitory potency of AMPH was highest on hNET-DM, intermediary on T258A and S259A single mutants and lowest on WT-hNET. Single mutants exhibited partial resistance to AMPH-mediated down-regulation. AMPH accumulation was similar in cells expressing WT-hNET or hNET-DM. The results demonstrate that reduced plasma membrane insertion and enhanced endocytosis account for AMPH-mediated NET down-regulation, and provide the first evidence that T258/S259 motif is involved only in AMPH-induced NET endocytosis that is desipramine-sensitive, but PKC and CaMKII independent.


Figures

Figure 1
Figure 1. AMPH inhibits NE uptake by HTR cells expressing WT-hNET, but not the hNET-DM
HTR cells transiently expressing WT-hNET or hNET-DM (A&B) or HTR-hNET or HTR-hNET-DM stable cells (C&D) were treated with 10 μM AMPH for 1, 5, 15 and 60 min at 37°C. Following treatments, cells were washed twice with transport assay buffer and NE uptake assays were performed as described under Materials and Methods section. To define specific NE transport via NETs, parallel uptake assays were carried out in the presence of 10 μM DMI. Data derived from three separate experiments, each in triplicate are given as mean ± S.E.M. *s indicate significant changes in NE transport following AMPH treatment compared to vehicle treatment (p < 0.01 by one-way ANOVA followed by Dunnett’s test).
Figure 2
Figure 2. AMPH down-regulates cell surface expression of WT-hNET, but not hNET-DM
HTR cells transiently expressing WT-hNET (A) or hNET-DM (B) were treated with vehicle or 10 μM AMPH for 5 and 15 min at 37°C. (C) HTR cells transiently expressing WT-hNET or hNET-DM were treated with vehicle or 10 μM AMPH for 60 min at 37°C. HTR-hNET or HTR-hNET-DM stable cells were treated with vehicle or 10 μM AMPH for 5, 15 and 60 min (D) at 37°C. Following treatments, cells were biotinylated with sulfo-NHS-biotin as described under Materials and Methods section. Equal aliquots from total (T) and avidin unbound fractions (UB) and entire eluates from avidin beads representing bound fractions (B) were loaded on to gels and the blot was probed with NET monoclonal antibody. Representative blots show two species of NET-specific bands at ~85 kDa and ~48 kDa. The amount of biotinylated and nonbiotinylated NETs were quantified using NIH image, and the densities of ~85 kDa band from three separate experiments are presented as mean ± S.E.M. Densities of biotinylated NETs are shown in upright bar graphs (A-D) and densities of nonbiotinylated NETs are shown in inverted bar graphs (A-C). *s indicate significant changes in cell surface and intracellular NETs following AMPH treatment compared to respective vehicle treatment (*, p < 0.01 by Student’s t-test). The blots corresponding to total were reprobed with anti-calnexin antibody to insure equal protein loading. *s indicate significant reductions in cell surface NET levels following AMPH treatment (*, p < 0.01 by Student’s t-test).
Figure 3
Figure 3. AMPH decreases NET plasma membrane recycling of both WT-hNET and hNET-DM following short time treatments
(A) HTR-hNET and (B) HTR-hNET-DM stable cells were treated with sulfo-NHS-acetate to block all the free amino groups prior to biotinylation with sulfo-NHS-biotin in the presence of vehicle or 10 μM AMPH for indicated time periods. Isolation of biotinylated and nonbiotinylated proteins and immunoblotting of NET proteins were performed as described under Materials and Methods section. A representative blot from biotinylation experiments shows changes in surface density of NETs following AMPH treatment. Biotinylated NETs (85 kDa) were quantified using NIH image, and band densities measured as % of total from three different experiments are shown in the lower panel as the mean ± S.E.M (Bar graphs). *s indicate significant changes in the recycling of plasma membrane NET following AMPH treatment compared to respective vehicle treatment at each time point (p < 0.05 by Student’s t-test). The blots were reprobed with anti-TfR antibody to examine drug-specific effect.
Figure 4
Figure 4. AMPH-induced NET endocytosis is blunted in hNET-DM
(A) HTR-hNET and (B) HTR-hNET-DM stable cells were biotinylated with sulfo-NHS-SS-biotin and incubated with vehicle or 10 μM AMPH for indicated time periods. Following MesNa treatment, biotinylated (internalized) NETs were isolated and analyzed as described under Materials and Methods section. Representative immunoblots from three separate experiments are given in upper panels. The bar graphs show biotinylated NET levels. The densities of ~85 kDa band from three separate experiments are given as mean ± S.E.M. *s indicate significant changes in NET internalization following AMPH treatment compared to vehicle treatment at each time point (p < 0.05 by Student’s t-test). The blots were reprobed with anti-TfR antibody to examine drug-specific effect.
Figure 5
Figure 5. PKC- or CAMKII- independent and DMI-sensitive NET down-regulation by AMPH
HTR-hNET stable cells were pretreated with (A) vehicle or 10 μM KN-62 or 100 nM or 1 μM staurosporine; (B) vehicle or 10 μM KN-93; for 10 min at 37°C and incubations were continued in the presence or absence of 10 μM AMPH for 60 min; (C) HTR-hNET cells were treated with the membrane-permeant Ca2+ chelator BAPTA-AM (10 μM) in Ca2+-free KRH buffer for 2 h at 37 °C to deplete both external and internal Ca2+ as described earlier (Jayanthi et al. 2004) or in parallel incubated in normal KRH buffer, and then treated with vehicle or 10 μM AMPH for 60 min at 37 °C; (D) HTR-hNET cells were treated with vehicle or 10 μM DMI (NET-specific blocker) for 10 min at 37°C and incubations were continued in the presence or absence of 10 μM AMPH for 60 min. Drug-treated cells were used for biotinylation assays as described under Materials and Methods section. Equal aliquots from total (T) and avidin unbound fractions (UB) and entire eluates from avidin beads representing bound fractions (B) were loaded on to gels and the blots were probed with NET monoclonal antibody. Representative blots show two species of NET-specific bands at ~85 kDa and ~48 kDa. The amount of biotinylated and nonbiotinylated NETs were quantified using NIH image, and the densities of ~85 kDa band from three separate experiments are presented as mean ± S.E.M. Densities of biotinylated NETs are shown in upright bar graphs and densities of nonbiotinylated NETs are shown in inverted bar graphs. *s indicate significant changes in cell surface and intracellular NETs following AMPH treatment compared to respective vehicle treatment (p < 0.01 by one-way ANOVA followed by Dunnett’s test). The blots corresponding to total were reprobed with anti-calnexin antibody to insure equal protein loading.
Figure 6
Figure 6. AIP failed to block AMPH-induced NET downregulation and AMPH did not alter phospho(p)-CaMKII levels
(A) HTR-hNET stable cells were pretreated with vehicle or 20 μM AIP for 10 min at 37°C and incubations were continued in the presence or absence of 10 μM AMPH. Drug-treated cells were used for biotinylation assays as described under Materials and Methods section. Equal aliquots from total (T) and avidin unbound fractions (UB) and entire eluates from avidin beads representing bound fractions (B) were loaded on to gels and the blots were probed with NET monoclonal antibody. Representative blots shows two species of NET-specific bands at ~85 kDa and ~48 kDa. The amount of biotinylated NET was quantified using NIH image, and the densities of ~85 kDa band from three separate experiments are presented as mean ± S.E.M. Bar graph shows biotinylated NET band densities as % of vehicle. *s indicates significant changes in surface NET immunoreactivity following AMPH treatment compared to respective vehicle-control (p < 0.01 by one-way ANOVA followed by Dunnett’s test). (B) HTR-hNET stable cells were treated with vehicle or 10 μM KN-93 or 10 μM KN-62 or 20 μM AIP for 10 min at 37°C and incubations were continued in the presence or absence of 10 μM AMPH for 60 min. (C) HTR-hNET stable cells were treated with vehicle or 10 μM KN-93 or 10 μM KN-62 or 20 μM AIP for 60 min at 37°C and incubations were continued in the presence or absence of 10 μM AMPH for 10 min. Equal aliquots of cell extracts were subjected to SDS-PAGE and immunoblotting with anti-p-CaMKII antibody and the p-CaMKII immunoreactive bands were shown.
Figure 7
Figure 7. AMPH-induced NET downregulation is partially blocked in HTR-hNET-T258A and HTR-hNET-S259A cells
HTR-hNET, HTR-hNET-T258A and HTR-hNET-S259A stable cells were treated with vehicle or 10 μM AMPH for 60 min at 37°C and used for biotinylation assays as described under Materials and Methods section. Equal aliquots from total (T) and avidin unbound fractions (UB) and entire eluates from avidin beads representing bound fractions (B) were loaded on to gels and the blots were probed with NET monoclonal antibody. Representative blots shows two species of NET-specific bands at ~85 kDa and ~48 kDa. The amount of biotinylated NET was quantified using NIH image, and the densities of ~85 kDa band from three separate experiments are presented as mean ± S.E.M. Bar graph shows biotinylated NET band densities as % of vehicle. * and # indicate significant changes in cell surface NET following AMPH treatment compared to respective vehicle treatment (*, p < 0.01; #, p ≤ 0.05; by Student’s t-test).
Figure 8
Figure 8. AMPH accumulation is similar in HTR cells expressing either WT-hNET or hNET-DM
HTR cells transiently expressing WT-hNET or hNET-DM were incubated with 10 nM AMPH (A) or 10 μM AMPH (B) in transport assay buffer and AMPH accumulation was measured as described under Materials and Methods section. (C) HTR-hNET or HTR-hNET-DM stable cells were incubated with 10 μM AMPH in transport assay buffer and AMPH accumulation was measured as described under Materials and Methods section. To define specific AMPH accumulation via NETs, parallel uptake assays were carried out in the presence of 100 μM DMI. Data derived from three separate experiments, each in triplicate are given as mean ± S.E.M.

References

    1. Apparsundaram S, Galli A, DeFelice LJ, Hartzell HC, Blakely RD. Acute regulation of norepinephrine transport: I. protein kinase C-linked muscarinic receptors influence transport capacity and transporter density in SK-N-SH cells. J Pharmacol Exp Ther. 1998;287:733–743. - PubMed
    1. Aromolaran AA, Blatter LA. Modulation of intracellular Ca2+ release and capacitative Ca2+ entry by CaMKII inhibitors in bovine vascular endothelial cells. Am J Physiol Cell Physiol. 2005;289:C1426–1436. - PubMed
    1. Boudanova E, Navaroli DM, Melikian HE. Amphetamine-induced decreases in dopamine transporter surface expression are protein kinase C-independent. Neuropharmacology. 2008;54:605–612. - PMC - PubMed
    1. Cervinski MA, Foster JD, Vaughan RA. Psychoactive substrates stimulate dopamine transporter phosphorylation and down-regulation by cocaine-sensitive and protein kinase C-dependent mechanisms. J Biol Chem. 2005;280:40442–40449. - PubMed
    1. Chen R, Furman CA, Zhang M, Kim MN, Gereau R. W. t., Leitges M, Gnegy ME. Protein kinase Cbeta is a critical regulator of dopamine transporter trafficking and regulates the behavioral response to amphetamine in mice. J Pharmacol Exp Ther. 2009;328:912–920. - PMC - PubMed

Publication types

MeSH terms