. 2010 Jun 15;18(6):913-26.
doi: 10.1016/j.devcel.2010.05.017.

CDK5RAP2 regulates centriole engagement and cohesion in mice

Affiliations

CDK5RAP2 regulates centriole engagement and cohesion in mice

Jose A Barrera et al. Dev Cell. .

Abstract

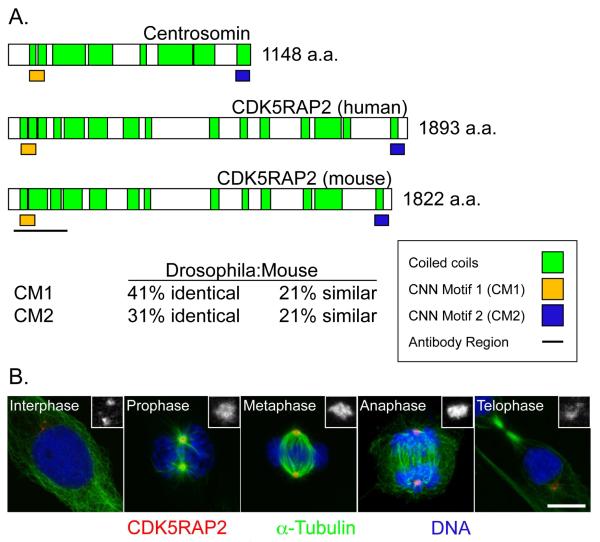
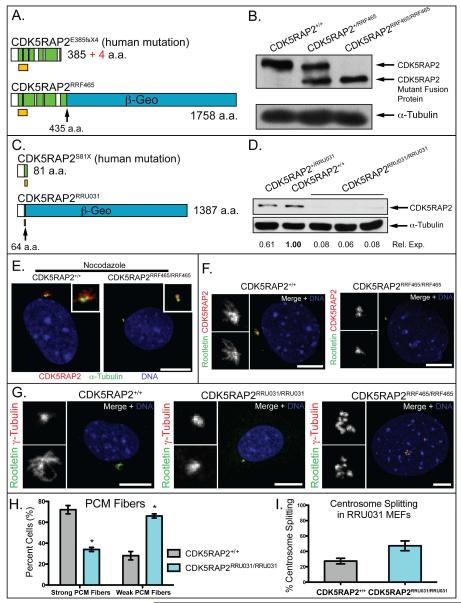
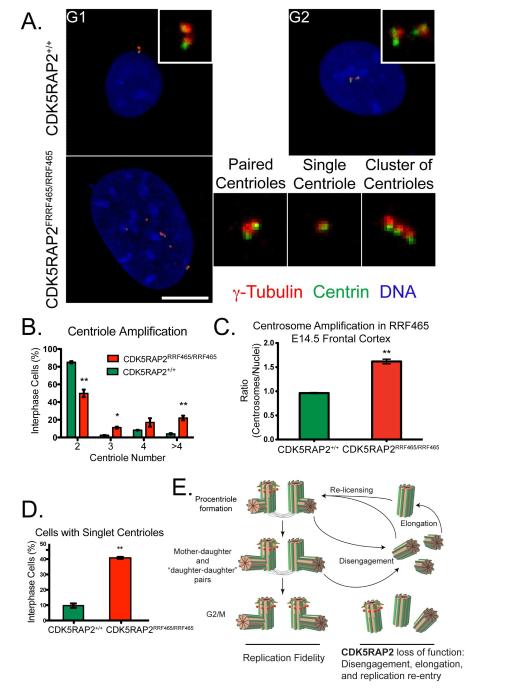
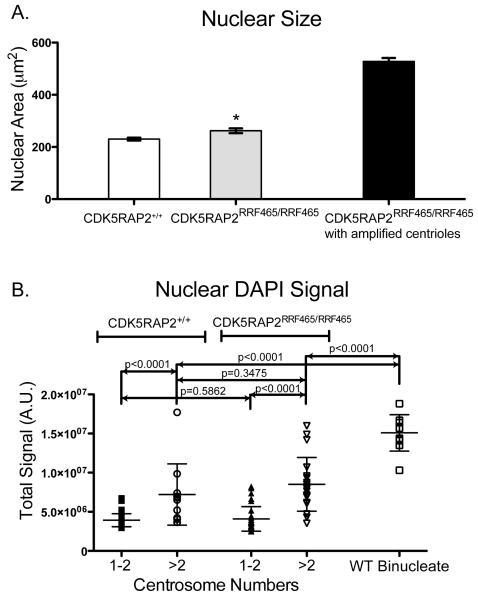
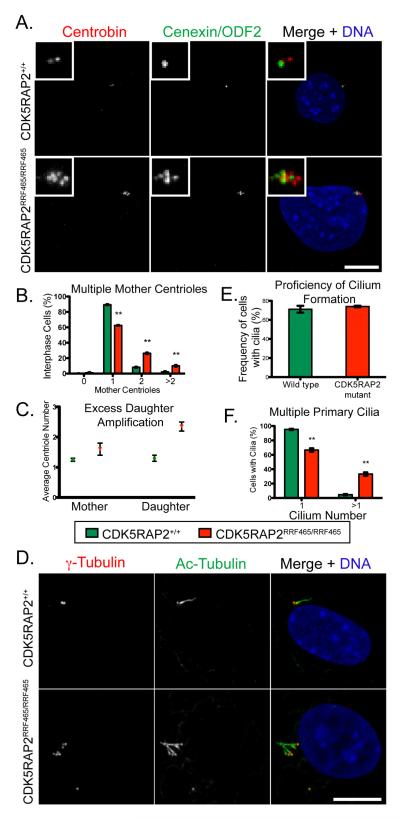
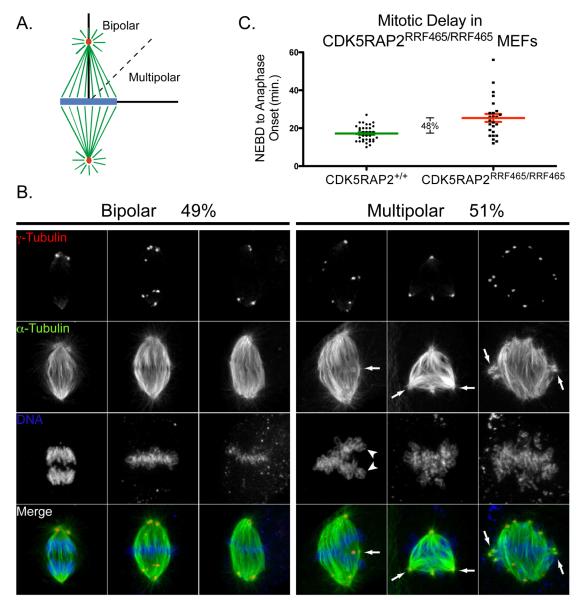
Centriole duplication occurs once per cell cycle, ensuring that each cell contains two centrosomes, each containing a mother-daughter pair of tightly engaged centrioles at mitotic entry. Loss of the tight engagement between mother and daughter centrioles appears to license the next round of centriole duplication. However, the molecular mechanisms regulating this process remain largely unknown. Mutations in CDK5RAP2, which encodes a centrosomal protein, cause autosomal recessive primary microcephaly in humans. Here we show that CDK5RAP2 loss of function in mice causes centriole amplification with a preponderance of single, unpaired centrioles and increased numbers of daughter-daughter centriole pairs. These results indicate that CDK5RAP2 is required to maintain centriole engagement and cohesion, thereby restricting centriole replication. Early in mitosis, amplified centrosomes assemble multipolar spindles in CDK5RAP2 mutant cells. Moreover, both mother and daughter centrioles are amplified and the excess mother centrioles template multiple primary cilia in CDK5RAP2 mutant cells.


Figures

Figure 1
Figure 1
CDK5RAP2 is a centrosomal protein whose levels change with the cell cycle (A) Schematic comparing Drosophila centrosomin (CNN), with human and mouse CDK5RAP2 proteins. Two conserved domains, each about 60 amino acids in length, are designated CNN motifs 1 (CM1) and 2 (CM2). The black line indicates the region used to raise antibodies. The identities and similarities between CNN and mCDK5RAP2 within CM1 and CM2 are shown. In addition to these conserved blocks, CNN family members contain extensive coiled-coil regions. (B) Immunofluorescence images of NIH-3T3 mouse fibroblasts stained for CDK5RAP2 (red), the microtubule marker α-tubulin (green), and DNA (blue) at different stages of the cell cycle. Insets are enlargements of CDK5RAP2 signal to highlight changes in CDK5RAP2 levels at centrosomes. Scale bar = 10 μm. See also Figure S1.
Figure 2
Figure 2
Centrosome disruption in CDK5RAP2 mutant MEFs (A,C) The truncated CDK5RAP2 products expressed in CDK5RAP2RRF465/RRF465 (A) and CDK5RAP2RRU031/RRU031 (C) mutant mice are similar to the two mapped human mutations. Schematics show the protein fragments predicted to result from the human mutations, E385fsX4 and S81X (Bond et al., 2005), and the CDK5RAP2/β-GEO mutant fusion proteins expressed in CDK5RAP2RRF465/RRF465 and CDK5RAP2RRU031/RRU031 mice. (B,D) Western blots of CDK5RAP2 from whole cell lysates collected from sibling MEF cultures of the indicated genotypes. The positions of the wild type and fusion proteins expressed in the RRF465 mutant (B), and the relative expression level of wild type CDK5RAP2 in the RRU031 mutant (D) are indicated. α-tubulin was probed as a loading control. (E) Nocodazole-treated CDK5RAP2+/+ and CDK5RAP2RRF465/RRF465 MEFs stained for CDK5RAP2 (red), α-tubulin (green), and DNA (blue). (F) CDK5RAP2+/+ and CDK5RAP2RRF465/RRF465 MEFs stained for CDK5RAP2 (red), the cohesion fiber protein rootletin (green), and DNA (blue). (G) Images of wild type and CDK5RAP2 mutant MEFs stained for γ-tubulin (red), the cohesion fiber protein rootletin (green), and DNA (blue). (H) Comparison between strong PCM fibers (CDK5RAP2+/+: 72% ± 4. vs. CDK5RAP2RRU031/RRU031: 34% ± 2%, p<0.05) and weak PCM fibers (CDK5RAP2+/+: 28% ± 4. vs. CDK5RAP2RRU031/RRU031: 66% ± 2., p<0.05). The CDK5RAP2RRU031/RRU031 MEF in (G) is an example of weak PCM fibers. n = 50 cells total from two independent cell lines. (I). Centrosome splitting was scored when centrosomes were >2μm apart (CDK5RAP2+/+: 27.4% ± 3.6% vs. CDK5RAP2RRU031/RRU031: 47.2% ± 6.4%, p<0.05). n = 110 cells total from five independent experiments. Insets are enlargements of the centrosome region and PCM fibers. Scale bar = 10 μm. See also Figure S2.
Figure 3
Figure 3
CDK5RAP2 restricts centriole duplication (A) CDK5RAP2+/+ and CDK5RAP2RRF465/RRF465 MEFs were stained for the PCM marker γ-tubulin (red), the centriole marker centrin (green), and DNA (blue). Paired centrioles in G1 and G2 CDK5RAP2+/+ MEFs are shown. The example CDK5RAP2RRF465/RRF465 MEF shows three singlet centrioles, one apparent pair, and a cluster of three. Three enlargements are shown on the right. Scale bar = 10 μm. (B) Quantification of cells with 2, 3, 4, or greater than 4 centrioles in CDK5RAP2+/+ (green bars) and CDK5RAP2RRF465/RRF465 (red bars) cells. MEFs containing 2 centrioles (CDK5RAP2+/+: 85.0% ± 1.3% vs. CDK5RAP2RRF465/RRF465: 49.8% ± 2.5%, p<0.01), 3 centrioles (CDK5RAP2+/+: 2.5% ± 0.3% vs. CDK5RAP2RRF465/RRF465: 11.2% ± 0.6%, p<0.05), 4 centrioles (CDK5RAP2+/+: 8.3% ± 0.3% vs. CDK5RAP2RRF465/RRF465: 17% ± 2.8%, p>0.05), and greater than 4 centrioles (CDK5RAP2+/+: 4.2% ± 0.7% vs. CDK5RAP2RRF465/RRF465: 22.0% ± 1.5%, p<0.005). (C) Quantification of cells showing singlet centrioles in CDK5RAP2+/+ (9.7% ± 1.4%, green bars) and CDK5RAP2RRF465/RRF465 (40.8% ± 0.6%, p<0.005, red bars) cultures. Data were collected from 3 independent experiments, n = 200 cells per experiment. (D) E14.5 coronal brain sections from CDK5RAP2+/+ and CDK5RAP2RRF465/RRF465 embryonic mice were stained for pericentrin and DNA and the numbers of nuclei and centrosomes counted in multiple fields. Three or more fields were counted in three separate brain sections. CDK5RAP2+/+ brains had a centrosome to nuclei ratio of 0.96 ± 0.01 compared to 1.62 ± 0.05 in CDK5RAP2RRF465/RRF465 brains (p=0.0051). (E) Model of daughter centriole amplification in CDK5RAP2RRF465/RRF465 cells. In wild type cells, disengaged mother (with red subdistal appendages) and daughter centrioles template assembly of a new centriole in S phase. The two centriole pairs remain engaged and at G2 the older daughter centriole is decorated with mother centriole vestments. We propose that in CDK5RAP2RRF465/RRF465 cells the parent centrioles fail to remain engaged with the nascent centrioles they have fostered, leading to re-licensing and reduplication of the disengaged centrioles, thereby increasing the pool of “daughter-daughter” pairs transiting from S to G2. See also Table 1 and Figure S3.
Figure 4
Figure 4
CDK5RAP2RRF465/RRF465 MEFs with amplified centrioles have enlarged nuclei (A) Nuclei were stained with DAPI, and nuclear area (μm2) was measured from micrographs (CDK5RAP2+/+: 230.3 μm2 ± 5.6 μm2 vs. CDK5RAP2RRF465/RRF465: 262.0 μm2 ± 9.5 μm2, p<0.05); n ≥ 200 cells per experiment. CDK5RAP2RRF465/RRF465 MEFs with amplified centrioles predominate this phenotype, with an area of 528.0 μm2 ± 13.4 μm2; n = 50 cells per experiment. Data were collected from 3 independent experiments. (B) DAPI signal (arbitrary units) was compared between CDK5RAP2+/+ and CDK5RAP2RRF465/RRF465 MEFs with one or two centrosomes (CDK5RAP2+/+: 3.9 × 10⁶ ± 0.1 × 10⁶, filled square vs. CDK5RAP2RRF465/RRF465: 4.0 × 10⁶ ± 0.3 × 10⁶, filled triangle) and MEFs with greater than two centrosomes (CDK5RAP2+/+: 7.2 × 10⁶ ± 1.2 × 10⁶, open circle vs. CDK5RAP2RRF465/RRF465: 8.5 × 10⁶ ± 0.8 × 10⁶, open triangle) and these were then compared to wild type binucleate cells (15.0 × 10⁶ ± 0.7 × 10⁶, open square); n = 10 and 11 for wild type binucleate cells and CDK5RAP2+/+ MEFs with one or two centrosomes, respectively and n ≥20 for all other samples. See also Figure S4.
Figure 5
Figure 5
Supernumerary mother centrioles and primary cilia in CDK5RAP2RRF465/RRF465 MEFs (A) CDK5RAP2+/+ and CDK5RAP2RRF465/RRF465 MEFs stained with the daughter centriole-specific marker centrobin (left, red in merged panel), the mother centriole-specific marker cenexin/ODF2 (middle, green in merge), and DNA (blue in merge). Insets show enlargements of the centriole region. (B) Percentages of cells with 0, 1, 2, or greater than 2 mother centrioles in CDK5RAP2+/+ (green bars) and CDK5RAP2RRF465/RRF465 (red bars) cells. MEFs containing 0 mother centrioles (CDK5RAP2+/+: 0.2% ± 0.2% vs. CDK5RAP2RRF465/RRF465: 1.2% ± 0.7%, p>0.05), 1 mother centriole (CDK5RAP2+/+: 89.3% ± 0.7% vs. CDK5RAP2RRF465/RRF465: 62.5% ± 0.5%, p<0.001), 2 mother centrioles (CDK5RAP2+/+: 8.2% ± 0.6% vs. CDK5RAP2RRF465/RRF465: 26.3% ± 0.9%, p<0.0005), or more than 2 mother centrioles (CDK5RAP2+/+: 2.3% ± 0.7% vs. CDK5RAP2RRF465/RRF465: 10.0% ± 1.0%, p<0.005). (C) Dot plot of the average number of mother (CDK5RAP2+/+: 1.3 ± 0.05 vs. CDK5RAP2RRF465/RRF465: 1.6 ± 0.2) and daughter (CDK5RAP2+/+: 1.3 ± 0.1 vs. CDK5RAP2RRF465/RRF465: 2.4 ± 0.15) centrioles per cell. Data were collected from three independent experiments, 90 cells total. (D) CDK5RAP2+/+ and CDK5RAP2RRF465/RRF465 MEFs stained for γ-tubulin (left, red in merged panel), the cilium axoneme marker acetylated α-tubulin (middle, green in merge), and DNA (blue in merge). Image in bottom panel shows four cilia in a cell with eight centrioles. (E) The percent of cells that formed primary cilia in CDK5RAP2+/+ (green bars) and CDK5RAP2RRF465/RRF465 (red bars) MEFs (CDK5RAP2+/+: 71.2% ± 3.6% vs. CDK5RAP2RRF465/RRF465: 74.0% ± 0.9%, p>0.05). (F) The percent of MEFs forming a single primary cilium (CDK5RAP2+/+: 95.3% ± 0.8% vs. CDK5RAP2RRF465/RRF465: 66.7% ± 2.4%, p<0.005) or more than one primary cilium (CDK5RAP2+/+, 4.7% ± 0.8% vs. CDK5RAP2RRF465/RRF465, 33.3% ± 2.4%, p<0.005). For (B), (E) and (F), data were collected from three independent experiments, n = 200 cells per experiment (except (F), where n = 150 cells with primary cilia per experiment). Scale bar = 10 μm. MEFs in (C-F) were blocked in G1 by serum starvation. See also Figure S5
Figure 6
Figure 6
Multipolar spindles form in CDK5RAP2RRF465/RRF465 MEFs. (A) Schematic outlining the criteria used to designate bipolar and multipolar spindle formation. To qualify as multipolar, spindles had an MTOC offset by greater than 45° from the dominant spindle axis as determined from spindle microtubules and DNA alignment. (B) Mitotic figures immunostained for γ-tubulin (1st row, red in merged panel), α-tubulin (2nd row, green in merge), and DNA (3rd row, blue in merge). In CDK5RAP2RRF465/RRF465 mitotic MEFs with multiple centrosomes, 51% of mitotic spindles were multipolar (n = 43). Arrows indicate examples of the excess spindle poles, and arrowheads indicate chromosomes configured improperly on the metaphase plate. Scale bar = 10 μm. (C) Scatter plot showing the timing from nuclear envelope breakdown (NEBD) to anaphase onset in CDK5RAP2+/+ and CDK5RAP2RRF465/RRF465 MEFs. In a small population of CDK5RAP2RRF465/RRF465 MEFs, the time between NEBD and anaphase onset was prolonged, with an approximately 8 min, or 47.7%, increase in the time spent to reach anaphase (CDK5RAP2+/+: 17.2 min. ± 0.7 min. vs. CDK5RAP2RRF465/RRF465: 25.4 min. ± 2.1 min., p<0.0001); n ≥ 25.

References

    1. Azimzadeh J, Bornens M. Structure and duplication of the centrosome. J Cell Sci. 2007;120:2139–2142. - PubMed
    1. Bahe S, Stierhof YD, Wilkinson CJ, Leiss F, Nigg EA. Rootletin forms centriole-associated filaments and functions in centrosome cohesion. J Cell Biol. 2005;171:27–33. - PMC - PubMed
    1. Basto R, Brunk K, Vinadogrova T, Peel N, Franz A, Khodjakov A, Raff JW. Centrosome amplification can initiate tumorigenesis in flies. Cell. 2008;133:1032–1042. - PMC - PubMed
    1. Bettencourt-Dias M, Glover DM. Centrosome biogenesis and function: centrosomics brings new understanding. Nat Rev Mol Cell Biol. 2007;8:451–463. - PubMed
    1. Bobinnec Y, Khodjakov A, Mir LM, Rieder CL, Edde B, Bornens M. Centriole disassembly in vivo and its effect on centrosome structure and function in vertebrate cells. J Cell Biol. 1998;143:1575–1589. - PMC - PubMed

Publication types

MeSH terms

Substances