. 2010 Jun 15;18(6):1041-52.
doi: 10.1016/j.devcel.2010.05.005.

A genome-wide siRNA screen reveals multiple mTORC1 independent signaling pathways regulating autophagy under normal nutritional conditions

Affiliations

A genome-wide siRNA screen reveals multiple mTORC1 independent signaling pathways regulating autophagy under normal nutritional conditions

Marta M Lipinski et al. Dev Cell. .

Abstract

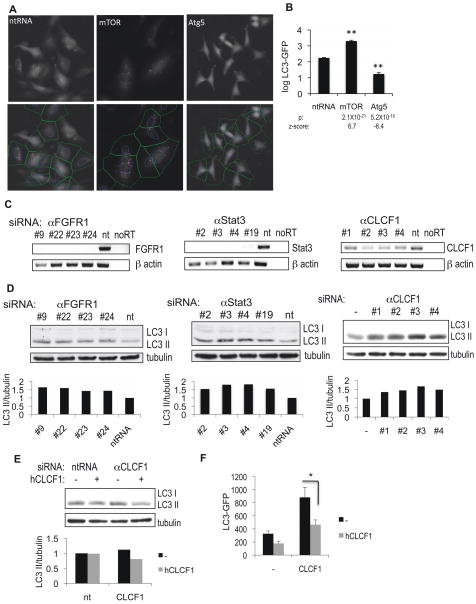
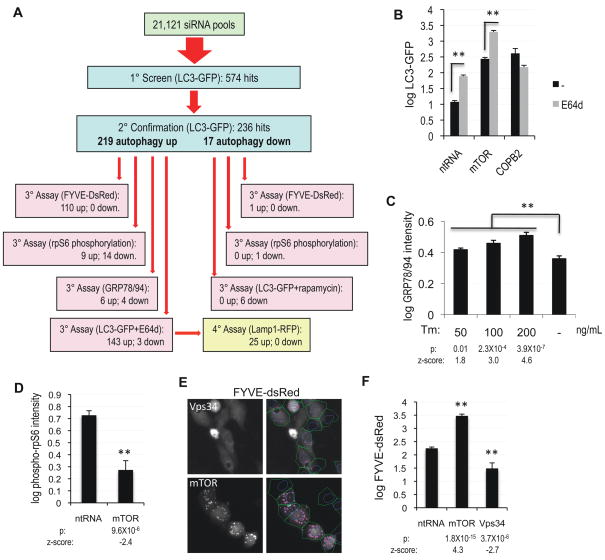
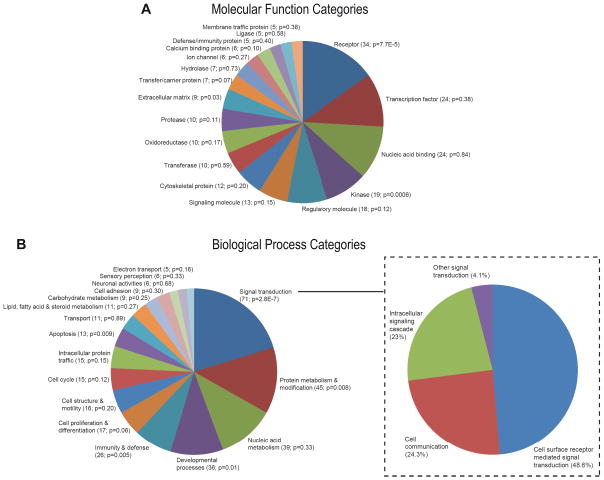
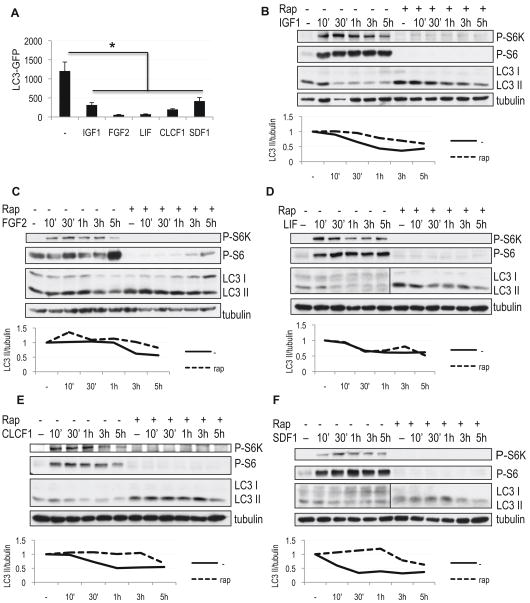
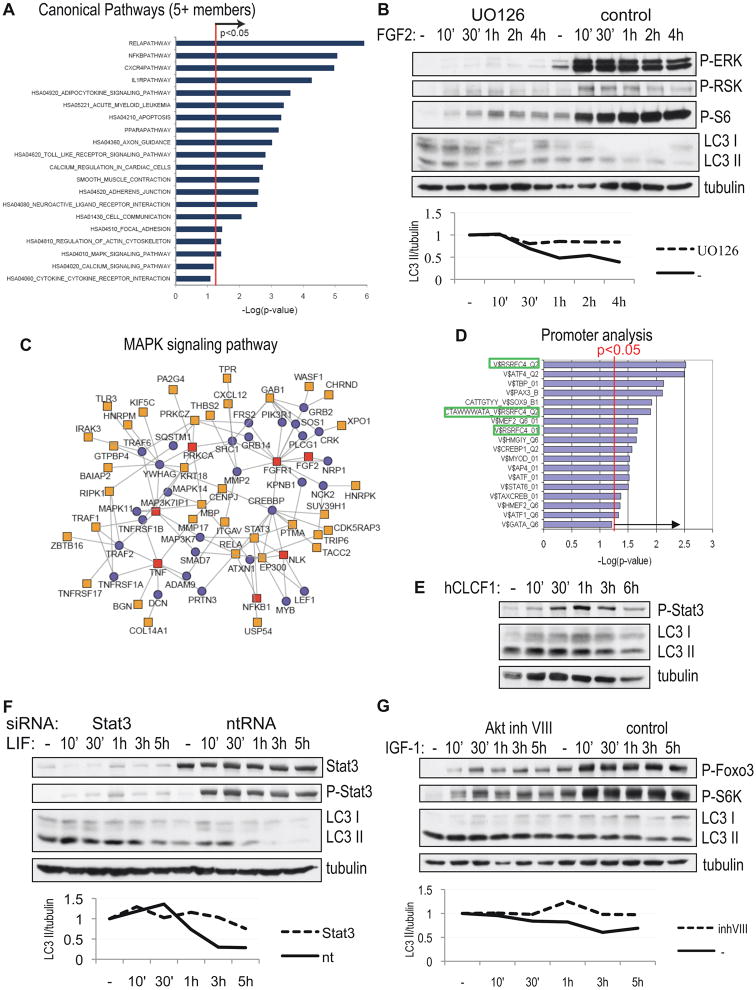
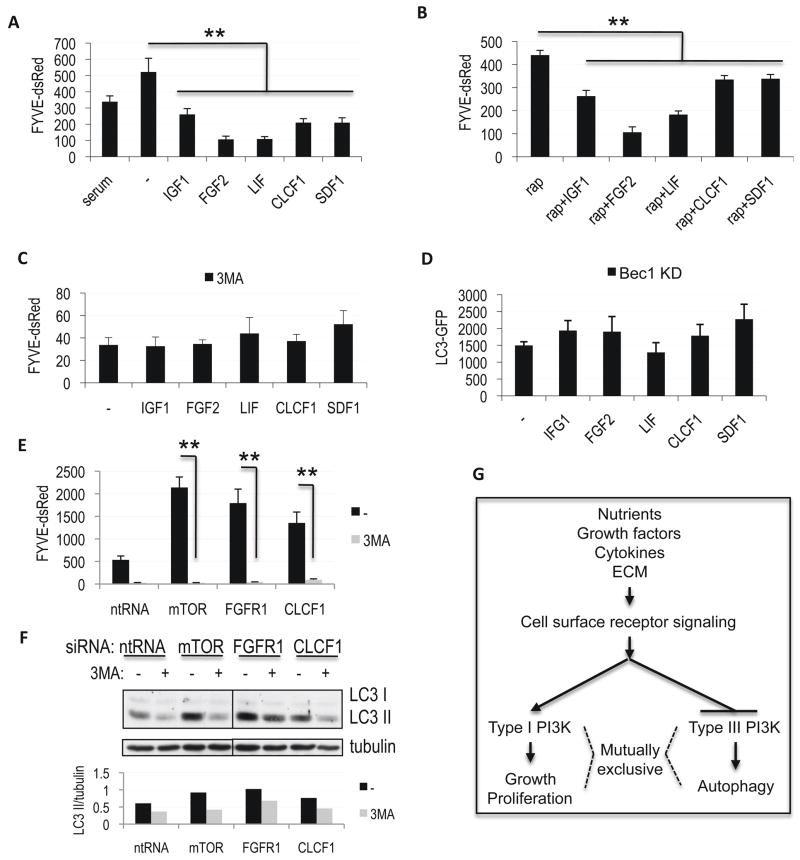
Autophagy is a cellular catabolic mechanism that plays an essential function in protecting multicellular eukaryotes from neurodegeneration, cancer, and other diseases. However, we still know very little about mechanisms regulating autophagy under normal homeostatic conditions when nutrients are not limiting. In a genome-wide human siRNA screen, we demonstrate that under normal nutrient conditions upregulation of autophagy requires the type III PI3 kinase, but not inhibition of mTORC1, the essential negative regulator of starvation-induced autophagy. We show that a group of growth factors and cytokines inhibit the type III PI3 kinase through multiple pathways, including the MAPK-ERK1/2, Stat3, Akt/Foxo3, and CXCR4/GPCR, which are all known to positively regulate cell growth and proliferation. Our study suggests that the type III PI3 kinase integrates diverse signals to regulate cellular levels of autophagy, and that autophagy and cell proliferation may represent two alternative cell fates that are regulated in a mutually exclusive manner.


Figures

Figure 1
Figure 1
High-throughput image-based screen for genes regulating autophagy. A, H4 cells stably expressing LC3-GFP were transfected with non-targeting siRNA (ntRNA) or siRNA against mTOR or Atg5 for 72h, fixed, counterstained with Hoechst and imaged on a high-throughput fluorescent microscope (10×). The bottom panels demonstrate results of image segmentation used for quantification of the ratio of soluble (diffuse cytosolic) versus autophagosome-associated (punctate) LC3-GFP: blue – nuclei, green – cell segmentation, pink – autophagosomal LC3-GFP. B, Quantification of data from (A). C, Confirmation of knock-down of selected screen hits by RT-PCR. H4 cells were transfected with indicated siRNAs for 72h. D, Confirmation of changes in levels of autophagy following knock-down of FGFR1, Stat3 or CLCF1 by western blot with antibodies against LC3. 10 μg/mL E64d was added to the media for 8 hours before cells were harvested. Quantification of LC3 II/tubulin ratio is shown. E–F, Exogenous CLCF1 can suppress increase in autophagy induced by knockdown of CLCF1. H4 (E) or H4 LC3-GFP (F) cells were transfected with non-targeting siRNA (nt) or siRNA against CLCF1 and grown in the absence or presence of 100 ng/mL human CLCF1. Levels of autophagy were assessed by western blot (E) or by quantification of autophagosomal LC3-GFP (F). All error bars are s.e.m. * p=0.05 based on two-tailed student t-test. n≥10
Figure 2
Figure 2
High-throughput characterization of the autophagy screen hits. A, Summary of all screen and characterization assays and their results. B, Quantification of levels of autophagy in H3 LC3-GFP cells transfected with non-targeting siRNA or siRNA against mTOR or COPB2. 10 μg/mL lysosomal protease inhibitor E64d was added for 8h before fixation. p(mTOR)=6.5×10⁻¹⁷ C, Quantification of ER stress in H4 cells treated with indicated levels of tumicamycin (Tm) for 24h by in-cell-western assay with antibody against GRP78 and GRP94. D, Quantification of mTORC1 activity by in-cell-western assay with antibody against phospho-rpS6 (Ser235/236) in H4 cells transfected with non-targeting siRNA or siRNA against mTOR for 72h. E, To assess the type III PI3 kinase activity, H4 cells stably expressing the PtdIns3P reporter FYVE-dsRed were transfected with siRNA against mTOR or Vps34. Right-hand panels represent the results of image segmentation used for quantification of the ratio of soluble (diffuse cytosolic) versus vesicle-associated (punctate) FYVE-dsRed: blue – nuclei, green – cell segmentation, pink – vesicular FYVE-dsRed. F, Quantification of data from panel (E). All error bars are s.e.m. n≥6
Figure 3
Figure 3
Autophagy is regulated in response to extracellular stimuli through multiple receptor mediated signaling pathways. AB, Classification of the autophagy screen hits into molecular function (A) and biological process (B) categories according to the PANTHER system. Panel B includes sub-divisions of the biological process ‘Signal transduction’ category. Categories with at least 5 genes are displayed. Categories with p<0.05 (hyper geometric distribution) are considered enriched.
Figure 4
Figure 4
Cytokines identified in the screen suppress autophagy independently of mTORC1 activity. A, Quantification of autophagy in H4 LC3-GFP cells grown in serum-free medium supplemented with indicated cytokines for 24h. All error bars are s.e.m. * p<0.05 n≥8 B–F, Cytokines are able to suppress autophagy in the absence and presence of rapamycin. H4 cells were grown in serum-free medium, followed by addition of 100 ng/mL IGF1 (B), 50 ng/mL FGF2 (C), 50 ng/mL LIF (D) or 50 ng/mL CLCF1 (F) and 10 μg/mL E64d. Where indicated, cells were pre-treated with 50 nM rapamycin 1 hour prior to the addition of cytokines. Levels of autophagy were assessed by western blot using antibody against LC3; mTORC1 activity was evaluated with antibodies against phospho-S6 (Ser235/236, P-S6) and phospho-S6 kinase (Thr389, P-S6K). Quantification of LC3 II/tubulin ratio is shown.
Figure 5
Figure 5
Growth signaling pathways negatively regulate autophagy in response to cytokines. A, Enrichment analysis of canonical pathways (MSigDB) among the hit genes relative to all genes examined in the screen. A p-value<0.05 (hyper geometric distribution) is considered significant. Only categories with at least five genes are displayed. B, Down-regulation of autophagy by 50 ng/mL FGF2 is prevented by addition of MEK inhibitor UO126. H4 cells were grown in serum-free media, levels of autophagy were assessed in the presence of 10 μg/mL E64d, with antibodies against LC3, inhibition MEK with phospho-ERK 1/2, phospho-RSK and phospho-S6 (Ser235/236). Quantification of LC3 II/tubulin ratio is shown. C, Network extensions of the canonical MAPK pathway. Using human interactome data, this pathway-centric network was constructed by anchoring on canonical pathway components and extended by establishing connections with other hit genes, including at most one intervening component. Red squares - screen hits that are part of the MAPK pathway, yellow squares – other screen hits, blue circles – intervening proteins. D, Enrichment analysis of cis-regulatory elements/transcription factor (TF)-binding sites in the promoters of the hit genes, using motif-based gene sets from MSigDB and TF-binding sites defined in the TRANSFAC database. SRF sites are highlighted. E, Phosphorylation of Stat3 following treatment with 50 ng/mL CLCF1. F, Down-regulation of autophagy by 50 ng/mL LIF is prevented by siRNA mediated knock-down of Stat3. H4 cells were transfected with indicated siRNAs for 72h, than cells were treated as in (B). Protein levels and phosphorylation of Stat3 are shown. G, Suppression of autophagy by 100 ng/mL IGF1 is prevented by Akt inhibitor VIII. Cells were treated as in (B); Akt activity was assessed with antibodies against phospho-Foxo3a and phospho-rpS6.
Figure 6
Figure 6
Regulation of autophagy by cytokines is dependent on the type III PI3 kinase. A–B, Quantification of PtdIns3P levels in H4 FYVE-dsRed cells grown in serum-free medium supplemented for 24h with 100 ng/mL IGF1, 50 ng/mL FGF2, 50 ng/mL LIF, 50 ng/mL CLCF1 or 50 ng/mL SDF1, in the absence (A) or presence (B) of 50 nM rapamycin. C, Quantification of PtdIns3P levels in H4 FYVE-dsRed cells treated with indicated cytokines in the presence of the type III PI3 kinase inhibitor 3MA (10 mM). D, Quantification of levels of autophagy following cytokine treatment of Beclin 1 knock-down H4 LC3-GFP cells. E–F, Induction of PtdIns3P levels in H4 FYVE-dsRed cells (E) and up-regulation of autophagy in H4 cells (F) following siRNA mediated knock-down of indicated genes is attenuated in the presence of 3MA. Cells were transfected with indicated siRNAs for 72h, 10 mM 3MA was added for 8h before cells were processed for analysis. For western blots 10 μg/mL E64d was added and quantification of LC3 II/tubulin ratio is shown. **p<0.01, n≥6 All error bars are s.e.m. G, Model for opposing regulation of cell growth and autophagy by the type I and type III PI3 kinases in response to changes in extracellular environment.

Comment in

  • The autophagy connection.
    Klionsky DJ. Klionsky DJ. Dev Cell. 2010 Jul 20;19(1):11-2. doi: 10.1016/j.devcel.2010.07.005. Dev Cell. 2010. PMID: 20643346 Free PMC article.

References

    1. Byfield MP, Murray JT, Backer JM. hVps34 is a nutrient-regulated lipid kinase required for activation of p70 S6 kinase. J Biol Chem. 2005;280:33076–33082. - PubMed
    1. Chatr-aryamontri A, Ceol A, Palazzi LM, Nardelli G, Schneider MV, Castagnoli L, Cesareni G. MINT: the Molecular INTeraction database. Nucleic Acids Res. 2007;35:D572–574. - PMC - PubMed
    1. Chung N, Zhang XD, Kreamer A, Locco L, Kuan PF, Bartz S, Linsley PS, Ferrer M, Strulovici B. Median absolute deviation to improve hit selection for genome-scale RNAi screens. J Biomol Screen. 2008;13:149–158. - PubMed
    1. Futreal PA, Coin L, Marshall M, Down T, Hubbard T, Wooster R, Rahman N, Stratton MR. A census of human cancer genes. Nat Rev Cancer. 2004;4:177–183. - PMC - PubMed
    1. Hara T, Nakamura K, Matsui M, Yamamoto A, Nakahara Y, Suzuki-Migishima R, Yokoyama M, Mishima K, Saito I, Okano H, et al. Suppression of basal autophagy in neural cells causes neurodegenerative disease in mice. Nature. 2006;441:885–889. - PubMed

Publication types