. 2010 Aug 1;137(15):2587-96.
doi: 10.1242/dev.043745.

A model of Costeff Syndrome reveals metabolic and protective functions of mitochondrial OPA3

Affiliations

A model of Costeff Syndrome reveals metabolic and protective functions of mitochondrial OPA3

Wuhong Pei et al. Development. .

Abstract

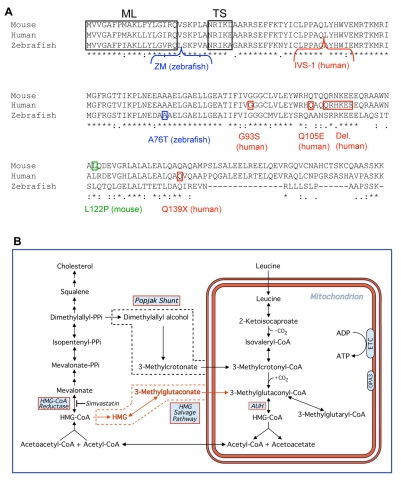
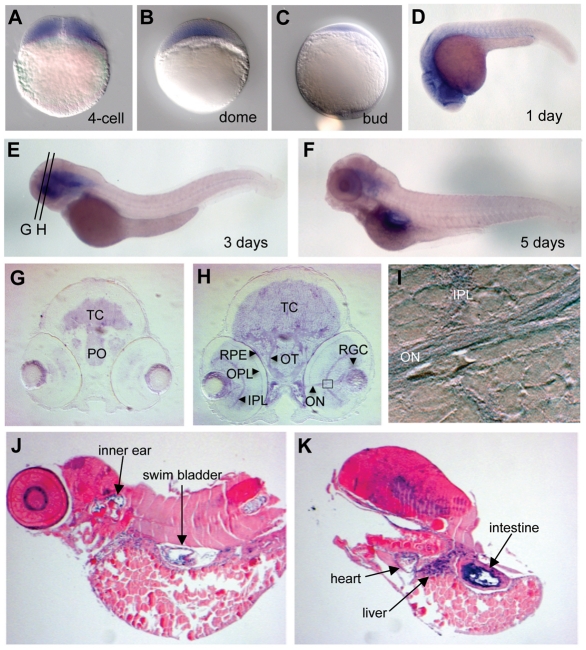
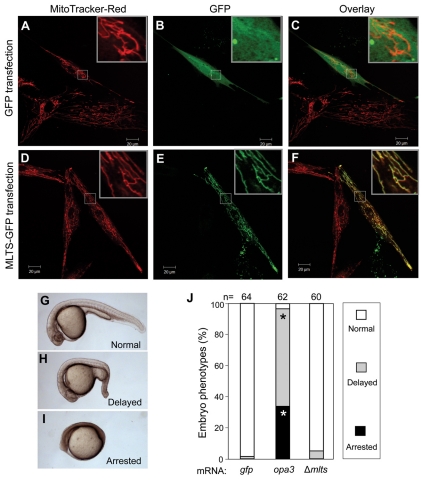
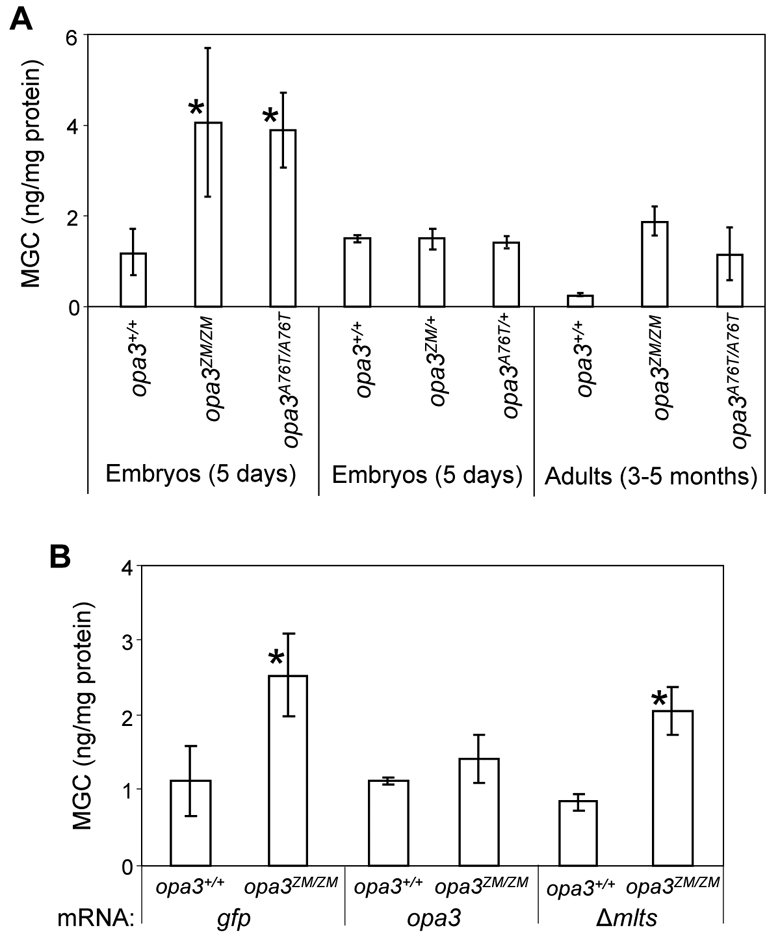
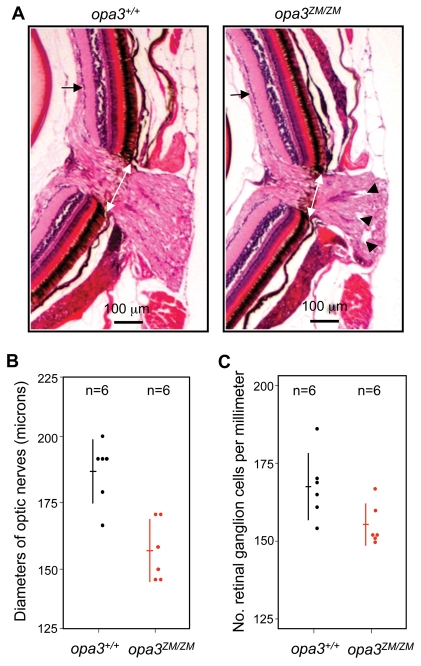
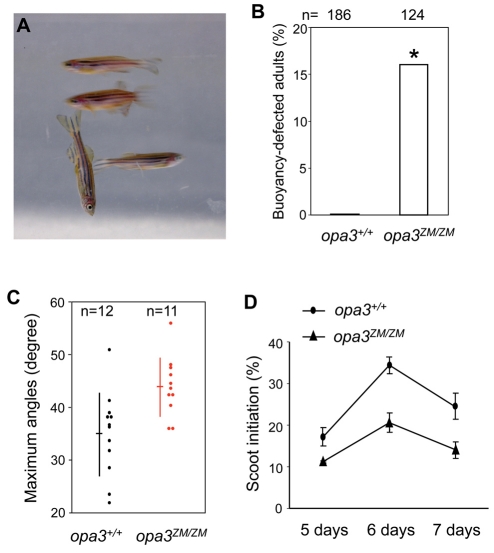
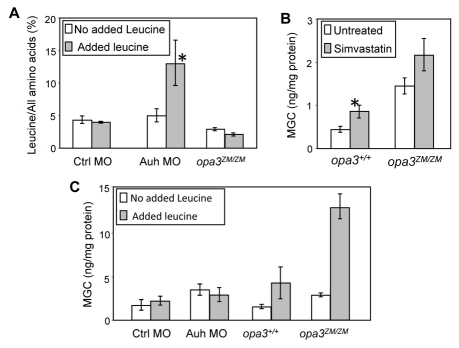
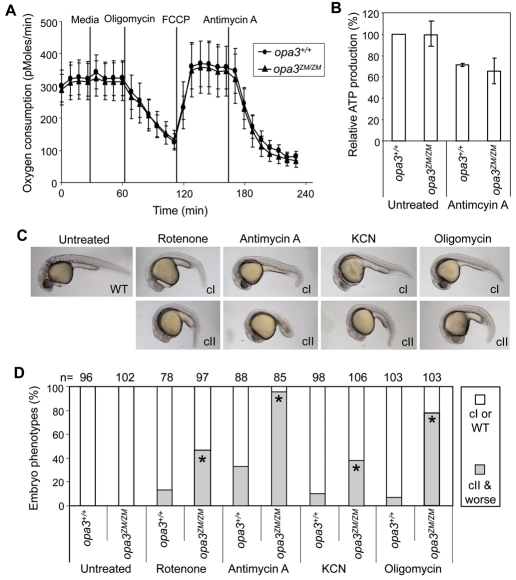
Costeff Syndrome, which is caused by mutations in the OPTIC ATROPHY 3 (OPA3) gene, is an early-onset syndrome characterized by urinary excretion of 3-methylglutaconic acid (MGC), optic atrophy and movement disorders, including ataxia and extrapyramidal dysfunction. The OPA3 protein is enriched in the inner mitochondrial membrane and has mitochondrial targeting signals, but a requirement for mitochondrial localization has not been demonstrated. We find zebrafish opa3 mRNA to be expressed in the optic nerve and retinal layers, the counterparts of which in humans have high mitochondrial activity. Transcripts of zebrafish opa3 are also expressed in the embryonic brain, inner ear, heart, liver, intestine and swim bladder. We isolated a zebrafish opa3 null allele for which homozygous mutants display increased MGC levels, optic nerve deficits, ataxia and an extrapyramidal movement disorder. This correspondence of metabolic, ophthalmologic and movement abnormalities between humans and zebrafish demonstrates a phylogenetic conservation of OPA3 function. We also find that delivery of exogenous Opa3 can reduce increased MGC levels in opa3 mutants, and this reduction requires the mitochondrial localization signals of Opa3. By manipulating MGC precursor availability, we infer that elevated MGC in opa3 mutants derives from extra-mitochondrial HMG-CoA through a non-canonical pathway. The opa3 mutants have normal mitochondrial oxidative phosphorylation profiles, but are nonetheless sensitive to inhibitors of the electron transport chain, which supports clinical recommendations that individuals with Costeff Syndrome avoid mitochondria-damaging agents. In summary, this paper introduces a faithful Costeff Syndrome model and demonstrates a requirement for mitochondrial OPA3 to limit HMG-CoA-derived MGC and protect the electron transport chain against inhibitory compounds.


Figures

Fig. 1.
Fig. 1.
OPA3 mutations and MGC-associated pathways. (A) Alignment of mouse, human and zebrafish OPA3. Consensus key: *, identical residues;:, strongly conserved residues;., weakly conserved residues; –, no orthologous residues. Black boxes frame the mitochondrial leader (ML) and targeting sequences (TS). Small red, blue and green boxes indicate human (red), zebrafish (blue) and mouse (green) point mutations. Red and blue brackets show insertion sites of the human IVS-1 mutation (red) and zebrafish retroviral DNA (blue). (B) Biochemical sources of MGC. Enzymatic steps known to be reversible are indicated with double-headed arrows. Two arrows in sequence, as well as the double-headed arrow connecting mitochondrial and extra-mitochondrial acetyl-CoA, represent two or more enzymatic steps. The Popjak shunt was proposed as a mechanism to explain experimental data showing that a substantial amount of carbon from mevalonate ultimately is metabolized in mitochondria, but the specific steps and localization of the shunt are not proven. The elements of the non-canonical `HMG salvage pathway' supported by the studies in this work are indicated in red.
Fig. 2.
Fig. 2.
Zebrafish opa3 expression in the brain, eye and other organs during embryogenesis. (A-F) Whole-mount in situ stains of opa3 mRNA. Embryonic stages are as labeled. Orientations: A-F,J-K, lateral views; G-I, frontal views. (G-I) opa3 expression in brain and eyes. (G,H) Transverse sections (approximate positions shown in E) through a 3-day-old opa3-stained embryo. TC, tectum; PO, pre-optic region; RPE, retinal pigment epithelium; OPL, outer plexiform layer; IPL, inner plexiform layer; OT, optic tract; ON, optic nerve; RGC, retinal ganglion cells. I shows a higher magnification view of the boxed region in H. (J,K) opa3 mRNA expression in a 5-day-old embryo. Embryos were laterally sectioned and counterstained with nuclear Fast Red.
Fig. 3.
Fig. 3.
Zebrafish Opa3 has functional mitochondrial leader and targeting sequences (MLTS). (A-F) Targeting assay. Human fibroblasts were transfected with plasmids expressing GFP or GFP linked to the MLTS of Opa3 (MLTS-GFP; Opa3 residues A1-S34 fused to the N terminus of GFP). A and D show the MitoTracker Red stains alone; B and E show GFP fluorescence; and C and F show the overlap of both signals. An enlarged inset in each image allows better visualization. (G-I) Gain-of-function assay. Wild-type embryos were injected with 200 pg of opa3 mRNA or mutated opa3 mRNA (Δmlts) from an opa3 vector in which the MLTS was deleted in frame (residues M1-K28 deleted, A29 converted to M). Embryonic phenotypes were scored at day 1. (J) Incidence of overexpression phenotypes. The number of embryos scored for each mRNA injection is indicated. Asterisks (*) indicate statistically significant increases (chi-square test, P<10–6) between the opa3 mRNA injected embryos and Δmlts mRNA-injected embryos. No difference was seen between Δmlts mRNA-injected embryos and gfp mRNA-injected embryos (P=0.2789).
Fig. 4.
Fig. 4.
MGC elevation in opa3 mutants and its MLTS-dependent reduction by Opa3. MGC values are normalized to protein yields of extracts. (A) Elevated MGC in embryonic and adult homozygotes. (B) Rescue of increased MGC with opa3 mRNA, but not Δmlts mRNA. opa3+/+ and opa3ZM/ZM embryos were injected with 25 pg of either opa3 mRNA, Δmlts opa3 mRNA or control gfp mRNA, and harvested the next day to measure MGC levels. Injected mRNAs are as indicated. Asterisks (*) indicate statistically significant increases (t-test, P<0.05). MGC increases were also seen in adult mutants, but the significance was not quantified because only two measurements were available.
Fig. 5.
Fig. 5.
Optic nerve deficits in opa3ZM/ZM mutants. (A) Sections of opa3+/+ and opa3ZM/ZM adult retinas. Three 1-year-old adult fish for each genotype were coronally sectioned and Hematoxylin and Eosin stained. One representative section is shown for each genotype. White arrows indicate optic nerve diameters and measurement points. Arrowheads indicate optic nerve lesions. Black arrows indicate retinal ganglion cells. (B,C) Comparison of optic nerve diameters (B) and retinal ganglion cell numbers (C) in opa3+/+ and opa3ZM/ZM adult fish. Each dot represents a single measurement, horizontal lines show the average and vertical lines show the standard deviation. Red lines and data points are significantly different from black lines and data points (t-test, P<0.015).
Fig. 6.
Fig. 6.
Behavioral anomalies of opa3ZM/ZM mutants. (A) Image of one abnormally swimming opa3ZM/ZM adult fish and three normal opa3ZM/ZM siblings. (B) Increased buoyancy in opa3ZM/ZM adult fish. Asterisk (*) indicates the statistical significance of the increase (chi-square test, P=2.1e–7). (C) Exaggerated vertical turns by opa3ZM/ZM adult fish. Each dot represents combined average of maximum ascent and descent angles observed for an individual fish. Horizontal lines show the overall average and vertical lines show the standard deviations. Red lines and data points are significantly different from black lines and data points (t-test, P=0.0055). (D) Reduced spontaneous scoot initiation by opa3ZM/ZM larvae. Circles show the average scoot frequency for four groups of 25 opa3+/+ larvae and triangles show the average scoot frequency for four groups of 25 opa3ZM/ZM larvae, each measured on three consecutive days. A significant reduction was observed in opa3ZM/ZM larvae (ANOVA test, F[1,9]=23.4, P=0.001).
Fig. 7.
Fig. 7.
opa3ZM/ZM embryos have normal leucine metabolism and their MGC production is refractory to HMG-CoA reductase inhibition. (A) Endogenous leucine levels in opa3ZM/ZM embryos and Auh morphants with and without leucine supplementation. Wild-type embryos injected with control MO or Auh MO, as well as uninjected opa3ZM/ZM embryos were mock treated or fed with leucine and harvested at 3 days to measure endogenous leucine levels. (B) MGC levels in opa3+/+ and opa3ZM/ZM embryos with and without HMG-CoA reductase inhibition. Embryos were either mock treated or exposed to 0.5 μM of simvastatin at the four-cell stage and harvested at day 1 for MGC measurement. (C) MGC levels in opa3ZM/ZM embryos and Auh morphants with and without leucine supplementation. Wild-type embryos injected with control MO or Auh MO, as well as uninjected opa3+/+ and opa3ZM/ZM embryos were mock treated or fed with leucine and harvested at 3 days to measure MGC levels. Asterisks (*) indicate statistically significant increases (t-test, P<0.05) in comparison with the controls on the left. A dramatic MGC increase was seen in leucine-supplemented opa3ZM/ZM mutants, but the significance was not quantified because only two measurements were available.
Fig. 8.
Fig. 8.
Loss of Opa3 does not affect overall energy metabolism, yet sensitizes embryos to inhibitors of the electron transport chain. (A) Equivalent mitochondrial respiration in opa3+/+ and opa3ZM/ZM embryos. Mitochondrial activity was inferred from the rate of oxygen depletion, as periodically measured in the micro-environment adjacent to groups of four 14-somite stage embryos, before and after the addition of compounds selected to maximize (FCCP) or minimize (oligomycin, antimycin A) the rate of oxidative phosphorylation. Short vertical lines indicate standard deviations and tall vertical lines show the times of each drug injection. (B) Equivalent ATP production in opa3+/+ and opa3ZM/ZM embryos. opa3+/+ embryos and opa3ZM/ZM embryos were either mock treated or treated with 1 ng/ml antimycin A starting at the four-cell stage and harvested on day 1 for ATP measurements. (C) Effects of ETC inhibitors on embryonic development. Embryos were treated with four different ETC inhibitors and scored at day 1. Resulting phenotypes are shown and categorized as class I (cI) and class II (cII). (D) Sensitivity of opa3ZM/ZM embryos to ETC inhibitors. A substantially larger fraction of opa3ZM/ZM embryos displayed class II phenotypes after drug treatment. Asterisks (*) indicate the statistical significance of the increases (chi square test, P<0.0001) in comparisons with the controls on the left.

References

    1. Andrews R. M., Griffiths P. G., Johnson M. A., Turnbull D. M. (1999). Histochemical localisation of mitochondrial enzyme activity in human optic nerve and retina. Br. J. Ophthalmol. 83, 231-231 - PMC - PubMed
    1. Anikster Y., Kleta R., Shaag A., Gahl W. A., Elpeleg O. (2001). Type III 3-methylglutaconic aciduria (optic atrophy plus syndrome, or Costeff optic atrophy syndrome): identification of the OPA3 gene and its founder mutation in Iraqi Jews. Am. J. Hum. Genet. 69, 1218-1218 - PMC - PubMed
    1. Bernhardt R. R., Tongiorgi E., Anzini P., Schachner M. (1996). Increased expression of specific recognition molecules by retinal ganglion cells and by optic pathway glia accompanies the successful regeneration of retinal axons in adult zebrafish. J. Comp. Neurol. 376, 253-253 - PubMed
    1. Bione S., D'Adamo P., Maestrini E., Gedeon A. K., Bolhuis P. A., Toniolo D. (1996). A novel X-linked gene, G4.5. is responsible for Barth syndrome. Nat. Genet. 12, 385-385 - PubMed
    1. Burgess H. A., Granato M. (2007). Modulation of locomotor activity in larval zebrafish during light adaptation. J. Exp. Biol. 210, 2526-2526 - PubMed

Publication types