. 2010 Oct 8;285(41):31380-7.
doi: 10.1074/jbc.M110.146084. Epub 2010 Jul 13.

Estrogen modification of human glutamate dehydrogenases is linked to enzyme activation state

Affiliations

Estrogen modification of human glutamate dehydrogenases is linked to enzyme activation state

Nikolas Borompokas et al. J Biol Chem. .

Abstract

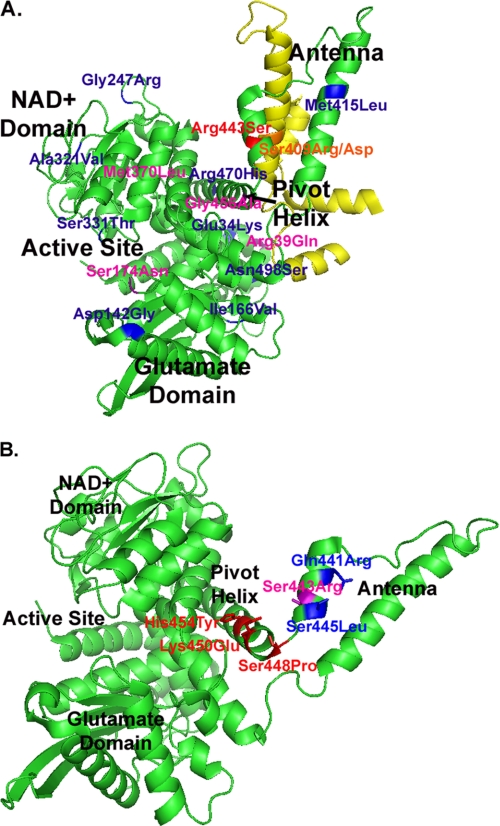
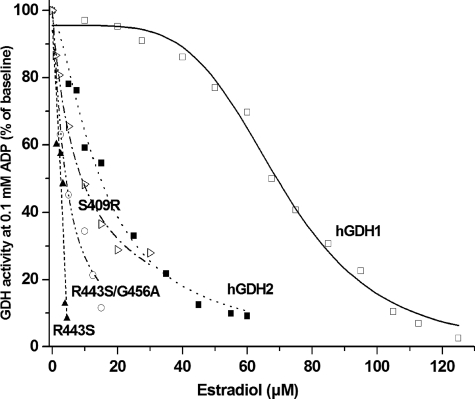
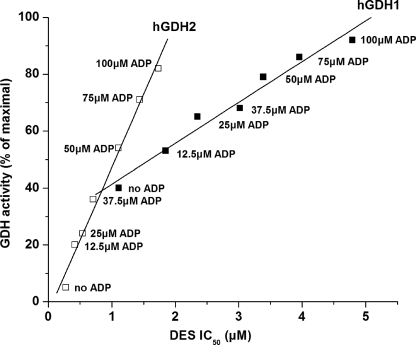
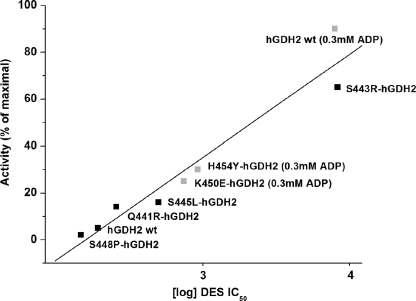
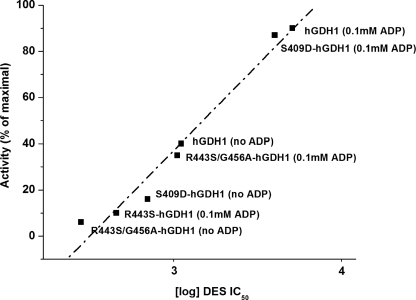
Mammalian glutamate dehydrogenase (GDH) is a housekeeping enzyme central to the metabolism of glutamate. Its activity is potently inhibited by GTP (IC(50) = 0.1-0.3 μM) and thought to be controlled by the need of the cell in ATP. Estrogens are also known to inhibit mammalian GDH, but at relatively high concentrations. Because, in addition to this housekeeping human (h) GDH1, humans have acquired via a duplication event an hGDH2 isoform expressed in human cortical astrocytes, we tested here the interaction of estrogens with the two human isoenzymes. The results showed that, under base-line conditions, diethylstilbestrol potently inhibited hGDH2 (IC(50) = 0.08 ± 0.01 μM) and with ∼18-fold lower affinity hGDH1 (IC(50) = 1.67 ± 0.06 μM; p < 0.001). Similarly, 17β-estradiol showed a ∼18-fold higher affinity for hGDH2 (IC(50) = 1.53 ± 0.24 μM) than for hGDH1 (IC(50) = 26.94 ± 1.07 μM; p < 0.001). Also, estriol and progesterone were more potent inhibitors of hGDH2 than hGDH1. Structure/function analyses revealed that the evolutionary R443S substitution, which confers low basal activity, was largely responsible for sensitivity of hGDH2 to estrogens. Inhibition of both human GDHs by estrogens was inversely related to their state of activation induced by ADP, with the slope of this correlation being steeper for hGDH2 than for hGDH1. Also, the study of hGDH1 and hGDH2 mutants displaying different states of activation revealed that the affinity of estrogen for these enzymes correlated inversely (R = 0.99; p = 0.0001) with basal catalytic activity. Because astrocytes are known to synthesize estrogens, these hormones, by interacting potently with hGDH2 in its closed state, may contribute to regulation of glutamate metabolism in brain.


Figures

FIGURE 1.
FIGURE 1.
Location of the introduced mutations in hGDH1 (A) and in hGDH2 (B). Shown is a cartoon diagram of the apo form of human GDH1 (Protein Data Bank entry 1LIF). For simplicity, only one of six subunits that compose the GDH hexamer are shown (in green), including its NAD+-binding domain, the glutamate-binding domain, the active site, the pivot helix, and the antenna. In A, the evolutionary mutation (R443S) that renders the enzyme markedly sensitive to estrogens is shown in red, whereas mutations that decrease estrogen sensitivity are shown in purple. Residues, mutation of which has no significant effect on estrogen sensitivity, are shown in blue. The antenna of an adjacent subunit, on the ascending helix of which Ser409 (orange) is located, is shown in yellow. As described in the text, Arg443 from one subunit is connected with hydrogen bonds with Ser409 of the adjacent subunit. In B, residues in the pivot helix and the junction of the pivot helix with the antenna, mutation of which in hGDH2 decreases basal activity (K450E, H454Y, and S448P) are shown in red. Residues in the antenna, mutation of which in hGDH2 increases basal activity (Q441R and S445L), are shown in blue. The reverse residue 443 mutation in hGDH2 (S443R) that markedly increases basal activity is shown in purple.
FIGURE 2.
FIGURE 2.
Inhibition of purified recombinant wild-type hGDH1 and hGDH2 and the R443S, R443S/G456A, and S409R hGDH1 mutants by 17β-estradiol in the presence of 0.1 mm ADP. GDH activity was measured in the direction of reductive amination of α-ketoglutarate in the presence of increasing concentrations of 17β-estradiol (0–125 μm). The data points represent the mean values of three experimental determinations and are expressed as percentages of GDH activity measured at 0.1 mm ADP in the absence of 17β-estradiol.
FIGURE 3.
FIGURE 3.
Estrogen inhibition of wild-type hGDH1 and hGDH2 at different activation states induced by ADP. The y axis shows the catalytic activity (expressed as percentages of maximal obtained at 1.0 mm ADP) displayed by each recombinant enzyme at the specific concentration of ADP prior to the addition of DES. The x axis shows the DES IC50 (± S.E.) values for each of the wild-type enzymes. ADP concentrations were varied from 0 to 100 μm (numbers next to the data points). The enzyme assays were performed in the direction of α-ketoglutarate reductive amination in TRA buffer, pH 8.0, as described under “Experimental Procedures.” The R correlation coefficient and P (probability that R is 0) values of the linear regression were calculated using the Origin Program. The slope of the regression line (± S.E.) is given below as the rate of change of enzyme basal activity (expressed as percentages of maximal) per increase in DES IC50: slope for hGDH1, 14.35 ± 1.14 (R = 0.9845, P < 0.0001); and slope for hGDH2, 51.16 ± 2.60 (R = 0.9935, P < 0.0001).
FIGURE 4.
FIGURE 4.
Regression analysis of DES IC50 for the wild-type hGDH2 and its mutants versus the basal catalytic activities of the recombinant enzymes. The y axis shows the catalytic activity (expressed as percentages of maximal) displayed by each recombinant enzyme prior to the addition of DES, measured either in the absence of ADP (basal activity) (Q441R, S443R, S445L, and S448P mutants and wild-type hGDH2) or in the presence of 0.3 mm ADP (K450E and H454Y mutants and wild-type hGDH2). At lower concentrations of ADP (0.1 or 0.2 mm), the K450E and H454Y mutants displayed very little measurable activity in the absence of ADP. For reasons of comparison, the DES IC50 for the wild-type hGDH2 was also obtained in the presence of 0.3 mm ADP. The x axis shows the DES IC50 values for each recombinant enzyme, in logarithmic scale. The R correlation coefficient and P (probability that R is 0) values of the linear regression were calculated using the Origin program (R = 0.9660, P < 0.0001).
FIGURE 5.
FIGURE 5.
Regression analysis of DES IC50 for the wild-type hGDH1 and its mutants versus the catalytic activities of the recombinant enzymes. The y axis shows the catalytic activity displayed by each recombinant enzyme prior to the addition of DES expressed as percentages of maximal activity. The DES IC50 values were calculated from the inhibitory curves for each of the recombinant enzyme using the Origin Program and are shown on the x axis, in logarithmic scale. The wild-type hGDH1 enzyme and its S409D and R443S/G456A mutants were studied either under basal conditions (no ADP) or in the presence of 0.1 mm ADP. However, the R443S mutant, which displayed very little activity under base-line conditions, was studied only in the presence of 0.1 mm ADP. The R correlation coefficient and P (probability that R is 0) values of the linear regression were calculated using the Origin program (R = 0.9864, P < 0.0001).

Similar articles

Cited by

References

    1. Gruber C. J., Tschugguel W., Schneeberger C., Huber J. C. (2002) N. Engl. J. Med. 346, 340–352 - PubMed
    1. Green P. S., Simpkins J. W. (2000) Int. J. Dev. Neurosci. 18, 347–358 - PubMed
    1. Amantea D., Russo R., Bagetta G., Corasaniti M. T. (2005) Pharmacol. Res. 52, 119–132 - PubMed
    1. Ba F., Pang P. K., Benishin C. G. (2004) Neurochem. Int. 45, 31–38 - PubMed
    1. Goodman Y., Bruce A. J., Cheng B., Mattson M. P. (1996) J. Neurochem. 66, 1836–1844 - PubMed

Publication types

MeSH terms

LinkOut - more resources