. 2010 Oct 21;116(16):3039-48.
doi: 10.1182/blood-2010-02-270322. Epub 2010 Jul 13.

Hepatic HIF-2 regulates erythropoietic responses to hypoxia in renal anemia

Affiliations

Hepatic HIF-2 regulates erythropoietic responses to hypoxia in renal anemia

Pinelopi P Kapitsinou et al. Blood. .

Abstract

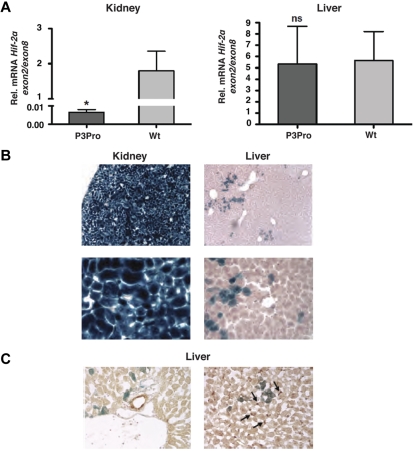
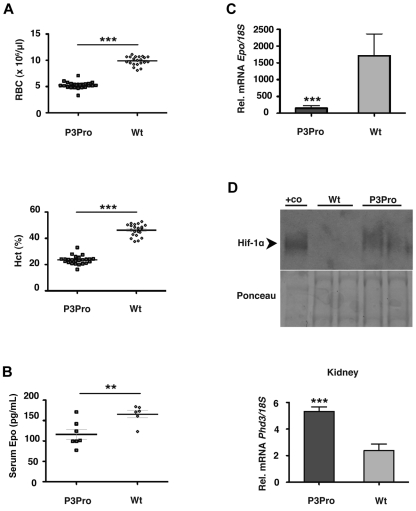
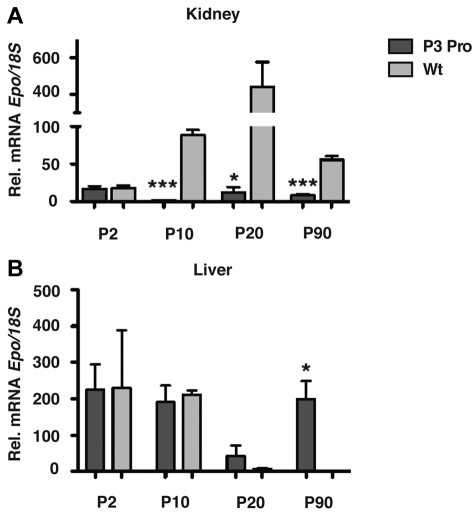
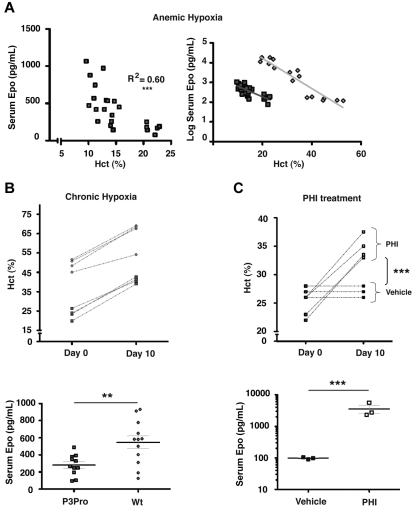
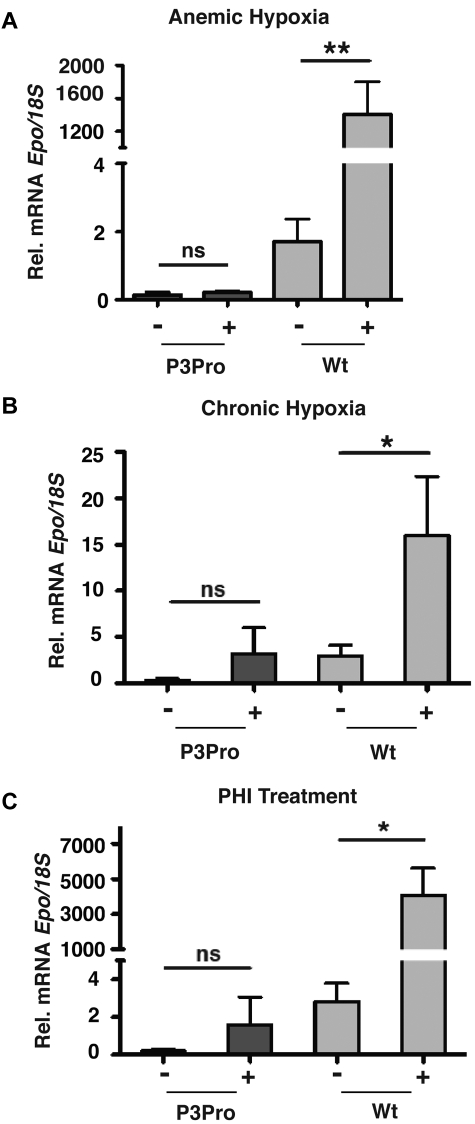
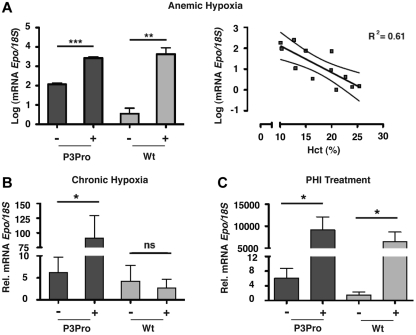
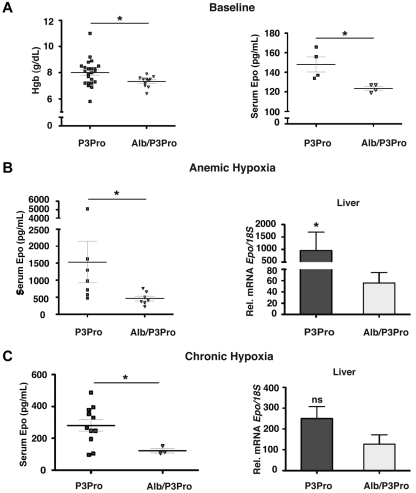
The kidney is the main physiologic source of erythropoietin (EPO) in the adult and responds to decreases in tissue oxygenation with increased EPO production. Although studies in mice with liver-specific or global gene inactivation have shown that hypoxia-inducible factor 2 (Hif-2) plays a major role in the regulation of Epo during infancy and in the adult, respectively, the contribution of renal HIF-2 signaling to systemic EPO homeostasis and the role of extrarenal HIF-2 in erythropoiesis, in the absence of kidney EPO, have not been examined directly. Here, we used Cre-loxP recombination to ablate Hif-2α in the kidney, whereas Hif-2-mediated hypoxia responses in the liver and other Epo-producing tissues remained intact. We found that the hypoxic induction of renal Epo is completely Hif-2 dependent and that, in the absence of renal Hif-2, hepatic Hif-2 takes over as the main regulator of serum Epo levels. Furthermore, we provide evidence that hepatocyte-derived Hif-2 is involved in the regulation of iron metabolism genes, supporting a role for HIF-2 in the coordination of EPO synthesis with iron homeostasis.


Figures

Figure 1
Figure 1
Hif-2α deletion in the kidney occurs with high efficiency. (A) Shown is the mean mRNA expression level of Hif-2α exon 2 in kidney and liver extracts by real-time PCR analysis (n = 6). Exon 2 is flanked by loxP site and targeted for Cre-mediated recombination. Exon 2 expression levels were normalized to Hif-2α exon 8, which is not deleted. Bars represent mean values ± SEMs. (B) LacZ staining of kidney and liver tissue from a P3Pro mouse expressing the ROSA26R Cre-reporter transgene. Magnification, ×100 (top) and ×400 (bottom). (C) P3Pro-Cre is not expressed in biliary epithelial or Ito cells. Immunohistochemistry was performed in conjunction with X-gal staining on frozen liver tissue sections. LacZ expression did not colocalize with cytokeratin 19 (CK19), which is specific for biliary epithelial cells (left) nor did it overlap with staining for desmin, which is a histologic marker of Ito cells (right). Shown are LacZ-positive cells (blue) and CK19- or desmin-positive cells (brown) on the left or right, respectively. Wt refers to Cre-negative littermates. Arrows depict desmin-positive cells. Magnification, ×400. *P < .05; ns, not statistically significant.
Figure 2
Figure 2
P3Pro-Cre–mediated inactivation of Hif-2α results in severe Epo-deficient anemia. (A) Shown are RBC and Hct values in 2- to 5-month-old P3Pro mutant mice (n = 26) compared with wild-type (Wt) littermate controls of the same age (n = 21). Diamonds represent control mice, P3Pro mutants are depicted by squares. (B) Serum Epo levels in 2-month-old mutants (n = 6) compared with Wt littermates (n = 5). (C) Relative Epo mRNA levels in kidneys from mutant and control animals (n = 9) as determined by real-time PCR analysis. (D) P3Pro mutant kidneys are hypoxic. (Top) Western blot analysis of Hif-1α in kidney extracts from mutant and Wt mice. Nuclear protein extracts from the liver of a Vhlh-deficient mouse were used as positive control (+co). Ponceau S staining is shown to demonstrate equal protein loading. (Bottom) mRNA levels of HIF target gene Phd3 in kidney (n = 6). Wt refers to Cre-negative littermates. Bars represent mean values ± SEMs; **P < .01, ***P < .001.
Figure 3
Figure 3
Hepatic Epo is not suppressed in P3Pro mutants. Relative Epo mRNA expression in kidneys (A) and livers (B) from mutants (dark gray bars) compared with littermate controls (light gray bars) at P2, P10, P20, and P90. Bars represent means ± SEMs (n = 3 for each genotypes and time point). *P < .05, ***P < .001.
Figure 4
Figure 4
Acute and chronic hypoxia triggers erythropoietic responses in P3Pro mutants. (A) In P3Pro mutant mice a linear decline in the Hct value is associated with an exponential increase in serum Epo levels in response to acute anemic hypoxia (R2 = 0.60, P < .0001). Linear regression analysis showed no statistically significant difference between slopes of increase in P3Pro mutants and control mice. Serum Epo levels were measured 24 hours after phlebotomy. (B) Exposure of P3Pro mutant mice to chronic normobaric hypoxia (10% O2 for 10 days) increases Hct values. (Bottom) The serum Epo levels shown in P3Pro mutant (n = 11) and in control mice (n = 12), were measured after 10 days of hypoxia. (C) Prolyl-4-hydroxylase inhibition with GSK1002083A raises Hct values and serum Epo levels in P3Pro mutants. Shown are Hct values before treatment (day 0) and after 10 days of treatment (day 10). Serum Epo levels in P3Pro mutants were measured 4 hours after administration of 2 doses (n = 3). Vehicle indicates treatment with 1% methylcellulose without compound; PHI, treatment with PHD inhibitor GSK 1002083A. **P < .01, ***P < .001.
Figure 5
Figure 5
Hypoxia and PHD inhibition do not induce Epo in P3Pro mutant kidneys. Shown are Epo mRNA levels in kidneys from P3Pro mutants and wild-type (Wt) littermate controls. (A) Exposure to acute anemic hypoxia induced by phlebotomy (measurements 24 hours after phlebotomy). (B) Exposure to chronic normobaric hypoxia (10% O2 for 10 days). (C) Oral administration of PHD inhibitor GSK1002083A (PHI) for 2 days. Wt refers to Cre-negative littermates. Bars represent mean Epo mRNA levels ± SEMs (n = 3 or 4 per genotype and time point). *P < .05, **P < .01; ns, not statistically significant.
Figure 6
Figure 6
Hypoxia and PHD inhibition stimulate hepatic Epo production in P3Pro mutants. Shown are Epo mRNA levels in livers from P3Pro mutants and wild-type (Wt) littermate controls. (A) Exposure to acute anemic hypoxia induced by phlebotomy (log scale; measurements 24 hours after phlebotomy). Shown also is a statistically significant association between the linear decline in Hct value and the exponential increase in hepatic Epo mRNA levels in P3Pro mutants (right; R2 = 0.61, P < .01). (B) Exposure to chronic normobaric hypoxia (10% O2 for 10 days). (C) Oral administration of PHD inhibitor GSK1002083A (PHI) for 2 days. Wt refers to Cre-negative littermates. *P < .05, **P < .01, ***P < .001; ns, not statistically significant.
Figure 7
Figure 7
Inactivation of hepatocyte-derived Hif-2 in P3Pro mutants blunts erythropoietic responses to hypoxia. (A) Hemoglobin concentrations (n = 23 for P3Pro; n = 11 for Alb/P3Pro) and serum Epo levels in Alb/P3Pro double mutants compared with P3Pro mutants (n = 4) under baseline conditions. (B) Serum Epo levels in P3Pro and Alb/P3Pro mutants after phlebotomy of (n = 7). Epo mRNA levels in livers of P3Pro and Alb/P3Pro mutants at baseline conditions (n = 3) and after phlebotomy (mice were analyzed 18 hours after phlebotomy; n = 7), as determined by real-time PCR. (C) Serum Epo levels in P3Pro (n = 13) and Alb/P3Pro mutants (n = 3) after chronic hypoxia exposure (10% O2 for 10 days) and corresponding Epo mRNA levels in P3Pro and Alb/P3Pro livers (n = 3). *P < .05; ns, not statistically significant.

Comment in

References

    1. Fandrey J. Oxygen-dependent and tissue-specific regulation of erythropoietin gene expression. Am J Physiol Regul Integr Comp Physiol. 2004;286(6):R977–R988. - PubMed
    1. Jelkmann W. Control of erythropoietin gene expression and its use in medicine. Methods Enzymol. 2007;435:179–197. - PubMed
    1. Wu H, Lee SH, Gao J, Liu X, Iruela-Arispe ML. Inactivation of erythropoietin leads to defects in cardiac morphogenesis. Development. 1999;126(16):3597–3605. - PubMed
    1. Koury ST, Bondurant MC, Koury MJ. Localization of erythropoietin synthesizing cells in murine kidneys by in situ hybridization. Blood. 1988;71(2):524–527. - PubMed
    1. Bachmann S, Le Hir M, Eckardt KU. Co-localization of erythropoietin mRNA and ecto-5′-nucleotidase immunoreactivity in peritubular cells of rat renal cortex indicates that fibroblasts produce erythropoietin. J Histochem Cytochem. 1993;41(3):335–341. - PubMed

Publication types