. 2010 Jul 1;6(7):e1000838.
doi: 10.1371/journal.pcbi.1000838.

Conductance ratios and cellular identity

Affiliations

Conductance ratios and cellular identity

Amber E Hudson et al. PLoS Comput Biol. .

Abstract

Recent experimental evidence suggests that coordinated expression of ion channels plays a role in constraining neuronal electrical activity. In particular, each neuronal cell type of the crustacean stomatogastric ganglion exhibits a unique set of positive linear correlations between ionic membrane conductances. These data suggest a causal relationship between expressed conductance correlations and features of cellular identity, namely electrical activity type. To test this idea, we used an existing database of conductance-based model neurons. We partitioned this database based on various measures of intrinsic activity, to approximate distinctions between biological cell types. We then tested individual conductance pairs for linear dependence to identify correlations. Contrary to experimental evidence, in which all conductance correlations are positive, 32% of correlations seen in this database were negative relationships. In addition, 80% of correlations seen here involved at least one calcium conductance, which have been difficult to measure experimentally. Similar to experimental results, each activity type investigated had a unique combination of correlated conductances. Finally, we found that populations of models that conform to a specific conductance correlation have a higher likelihood of exhibiting a particular feature of electrical activity. We conclude that regulating conductance ratios can support proper electrical activity of a wide range of cell types, particularly when the identity of the cell is well-defined by one or two features of its activity. Furthermore, we predict that previously unseen negative correlations and correlations involving calcium conductances are biologically plausible.


Conflict of interest statement

The authors have declared that no competing interests exist.

Figures

Figure 1
Figure 1. Levels of database segmentation based on single activity characteristics.
(A) The first tier of this hierarchy includes all models in the database. These models are then divided into groups based on activity type. The second tier includes the groups periodic spiking, irregular spiking, silent, periodic bursting, irregular bursting, and one-spike bursting models. For each group, the number of models (shown in percent of database) and the number of correlations found within that group is shown. The groups “periodic spiking” and “periodic bursting” are further subdivided in the third tier. The spiking models are partitioned by spike frequency in Hz, and the bursting models are partitioned by duty cycle. (B) In addition to duty cycle, periodic bursting neurons were also partitioned based on the slope of the rising phase of their slow wave activity. Three measurement techniques and segmentation schemes were used, two are shown here. See methods.
Figure 2
Figure 2. Histograms of main features used for partitioning the database.
(A) Periodic intrinsically spiking model neurons sorted by spike frequency. Thin vertical lines indicate group boundaries used for sorting activity type. Voltage traces are for models at the lower bound of each group. Bin size is 0.5 Hz. Scale bars for voltage traces are 20 mV (vertical) and 100 msec (horizontal). (B) Periodic intrinsically bursting model neurons sorted by duty cycle. Labeled lines indicate group boundaries and the duty cycle of adjacent voltage traces. Bin size is 0.01. Scale bars for voltage traces are 20 mV and 500 msec. (C) Periodic bursting models were also sorted by the average slope of the rising phase of their slow wave activity. Inset shows the method of calculation of this slope. Average slope was calculated between points 1 and 4 (see inset), to avoid any artifact generated by the sharp incline of the first spike in the burst. Bin size 0.001 mV/ms. Scale bar for inset is 200 msec. (D) Periodic bursting models were finally sorted by the central slope of the rise phase of the slow wave. Central slope was calculated by taking the average slope between points 2 and 4 seen on the inset in part C. Bin size 0.001 mV/ms. Scale bars for voltage traces are 40 mV and 200 msec.
Figure 3
Figure 3. Ramp-type conductance relationships can be fully explained by the independence assumption, whereas linear correlations cannot.
(A) The activity type “periodic bursters with duty cycle 0.1–0.2” tends toward high values of gKd and low values of gleak2 = 253, ρ = 0.006). Colors represent the number of models on each grid point. All maximal conductance units are mS/cm2. For each plot, no assumptions are made about the values of the other six conductances. (B) The same activity type shows a linear relationship between the CaS and KCa conductances (χ2 = 72,330, ρ = 0.627). The white outline encases correlation boundaries as used for creating a correlation-based population, see methods. (C,D) Data generated under the independence assumption. 1-D histograms protrude from the axis of the conductance they represent. The resulting independence matrix was generated by multiplying the two 1-D histograms, then scaling by total number of models in this activity group (see Methods). Color scale is the same in A and C and in B and D, respectively. (E,F) Difference matrix. The independence matrix (C,D) was subtracted from the actual data (A,B). Colors in (E,F) represent percent difference between independence matrix and actual data at each grid point.
Figure 4
Figure 4. All possible pair-wise conductance combinations for the group of spiking models with frequency between 50 and 75 Hz (upper right).
Color scheme represents the number of models. The lower left half of the plot contains the difference matrices for this activity type. The blue/red color scheme represents percent difference between data and the independence assumption (see Methods). For all plots, a bold border indicates a linear dependence according to our criteria (χ2>500 and |ρ|>0.2).
Figure 5
Figure 5. Eleven conductance relationships met the cutoff criteria for correlation, but did not have a convincing linear trend upon visual inspection.
These false-positives were not included in the correlation totals. (A) Example of plot which met criteria for correlation, but not linearity. From group “spikers <10 Hz”. (B) Difference plot for relationship in A. (C) Another example. From group “one-spike bursters”. (D) Difference plot for relationship in C.
Figure 6
Figure 6. Each activity type utilizes a unique combination of conductance correlations.
For all plots, a plus sign (+) indicates that a linear relationship with a positive slope was found for this conductance pair. Likewise, a minus sign (−) indicates a linear relationship with a negative slope. (A) Summary of entire database. If a correlation was seen, in any activity subsection investigated, it is included here. Conductance pairs shown in dark grey are those that have not yet been observed experimentally, whereas those highlighted with light grey have been found in experiments on STG neurons , . Two negative relationships reported here (gNa vs. gKd and gA vs. gKCa) were found to be positive relationships when investigated experimentally by Schulz et al . However, there is also agreement with experimental results, such as a positive correlation (gA vs. gH) found by Khorkova and Golowasch . Numbers indicate how many activity types showed a particular conductance correlation. (B) Example of how restricting multiple aspects of activity type may influence the appearance of correlations. The bottom row shows correlations for populations based solely on one of the previously published pacemaker criteria . Arrows indicate populations based on combinations of these criteria. Shading here is used only to show that a correlation was present in a “parent” population; if a plus or minus sign is absent then no correlation was observed. %CB is %Success for a correlation-based population, %O is %Success for the original database, and f is the ratio of the two, or fSuccess. See Methods. (C) Periodic bursting models were either segmented by duty cycle, or the slope of the rising phase of the slow wave. The correlations of all activity subsections created for each schema are summarized here. Shading is used for contrast only. (D) All correlation types seen in any of the spike frequency defined activity types and all correlation types seen in the irregular spiking group.
Figure 7
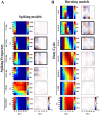
Figure 7. Values of gA and gKCa are correlated for spiking models with a frequency between 25 and 75 Hz and bursting models with duty cycle between 0.2 and 0.6.
Spiking models are represented by the leftmost two columns (A), and bursting models are shown to the right (B). Frequency or duty cycle range is specified to the left of each pair of plots, excluding the bottom row which represents all spiking or bursting models. Bold black borders indicate a correlation (χ2>500 and |ρ|>0.2). The gA and gKCa relationship in bursting models with duty cycle >0.6 (top right) was considered a false negative result (χ2 = 262, ρ = −0.33).
Figure 8
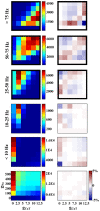
Figure 8. Values of gNa and gCaT are correlated for spiking models with a frequency greater than 25 Hz.
Bold black borders indicate a correlation (χ2>500 and |ρ|>0.2).
Figure 9
Figure 9. Correlation-based populations increased the percentage of models with a desired activity type.
(A) Implementation of correlations individually had a modest, but always positive, effect on the percentage of models with the desired intrinsic activity type (%Success), contrary to the random-sample controls. Histograms are stacked in the rare case of overlap. Bin size is 0.1%. (B) Implementation of all correlations seen in an activity type increased %Success by as much as 37 fold. Bin size is 1%. (C) The percentage of a particular activity type in the original database (% original) is plotted against the percentage of models of that activity type in a correlation-based population (% correlation-based). Both single-correlation based populations (grey triangles) and multiple-correlation based populations (black stars) are shown. Unity line is shown for scale.

References

    1. Harris-Warrick RM, Marder E, Selverston AI, Moulins M, editors. Dynamic Biological Networks: The Stomatogastric Nervous System. Cambridge, Massachusetts: The MIT Press; 1992. 328
    1. Prinz AA, Bucher D, Marder E. Similar network activity from disparate circuit parameters. Nat Neurosci. 2004;7:1345–1352. - PubMed
    1. Schulz DJ, Goaillard JM, Marder E. Variable channel expression in identified single and electrically coupled neurons in different animals. Nat Neurosci. 2006;9:356–362. - PubMed
    1. Marder E, Thirumalai V. Cellular, synaptic and network effects of neuromodulation. Neural Netw. 2002;15:479–493. - PubMed
    1. Marder E, Prinz AA. Modeling stability in neuron and network function: the role of activity in homeostasis. Bioessays. 2002;24:1145–1154. - PubMed

Publication types

Substances