. 2010 Jul 8;6(7):e1000988.
doi: 10.1371/journal.ppat.1000988.

Functional genetic diversity among Mycobacterium tuberculosis complex clinical isolates: delineation of conserved core and lineage-specific transcriptomes during intracellular survival

Affiliations

Functional genetic diversity among Mycobacterium tuberculosis complex clinical isolates: delineation of conserved core and lineage-specific transcriptomes during intracellular survival

Susanne Homolka et al. PLoS Pathog. .

Abstract

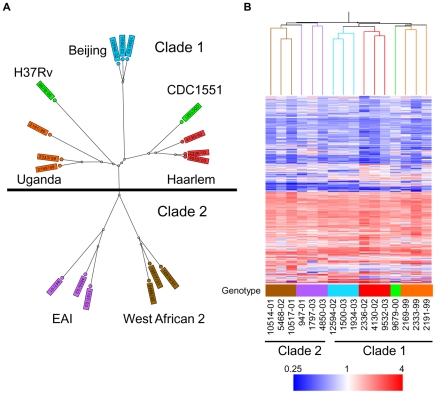
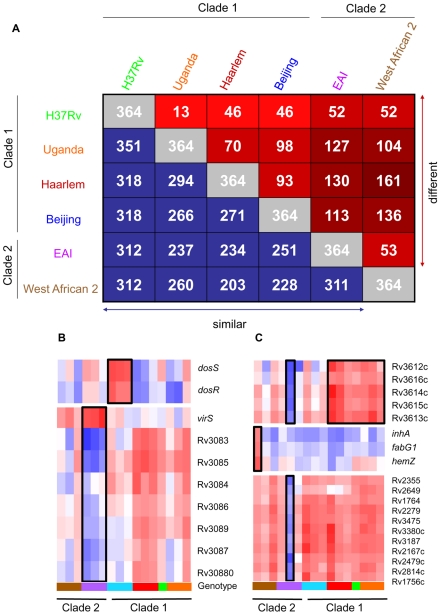
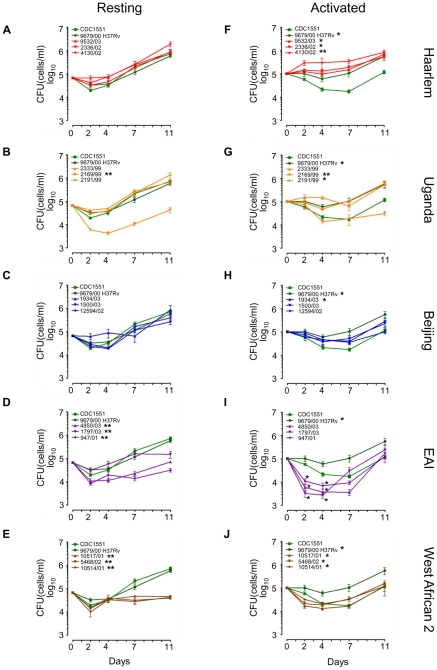
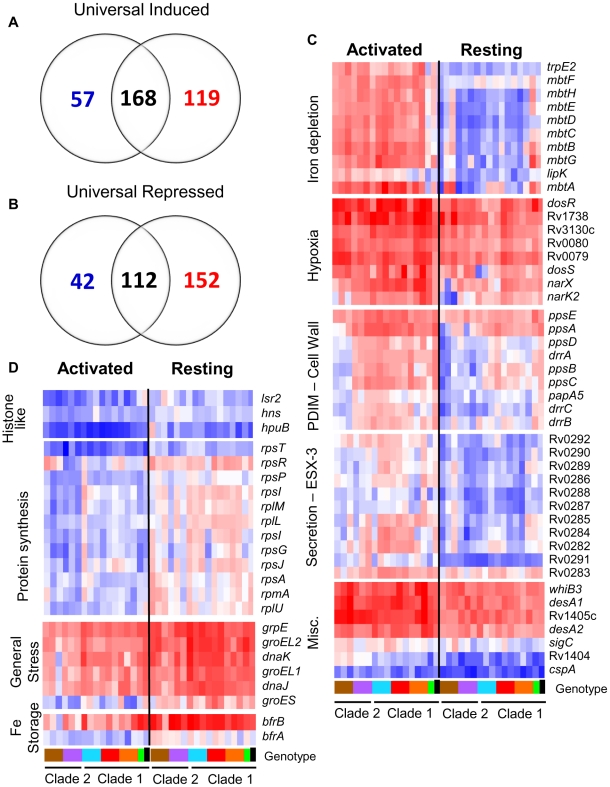
Tuberculosis exerts a tremendous burden on global health, with approximately 9 million new infections and approximately 2 million deaths annually. The Mycobacterium tuberculosis complex (MTC) was initially regarded as a highly homogeneous population; however, recent data suggest the causative agents of tuberculosis are more genetically and functionally diverse than appreciated previously. The impact of this natural variation on the virulence and clinical manifestations of the pathogen remains largely unknown. This report examines the effect of genetic diversity among MTC clinical isolates on global gene expression and survival within macrophages. We discovered lineage-specific transcription patterns in vitro and distinct intracellular growth profiles associated with specific responses to host-derived environmental cues. Strain comparisons also facilitated delineation of a core intracellular transcriptome, including genes with highly conserved regulation across the global panel of clinical isolates. This study affords new insights into the genetic information that M. tuberculosis has conserved under selective pressure during its long-term interactions with its human host.


Conflict of interest statement

The authors have declared that no competing interests exist.

Figures

Figure 1
Figure 1. Genetic and transcriptome diversity of M. tuberculosis complex (MTC) clinical isolates.
(A) Radial neighbor-joining tree based on 24 loci MIRU-VNTR and 43 spacer spoligotyping showing the phylogenetic relationship of strains in this study. Three strains each from the 5 distinct lineages pathogenic to humans plus two sequenced reference strains (H37Rv and CDC1551) were chosen to represent the global diversity of MTC. The color used to denote each genotype is maintained in all subsequent figures for clarity. (B) Condition tree of MTC clinical isolate transcription profiles in vitro during log phase growth in 7H9 medium relative to CDC1551 reference strain (three biological replicates). Expression profiles for genes passing quality filters (flagged as present in 42 of 48 samples) with differential expression in at least one strain (up or down >1.5× in at least 1 of 16) were clustered using the Spearman correlation. Each column represents the global transcription profile of a single strain. Genes were clustered vertically based on the distance measure. Red and blue indicate higher or lower gene expression than CDC1551 control, respectively. Unless otherwise indicated, the color scale for expression (4-fold up or down) was used for all subsequent figures.
Figure 2
Figure 2. Identification of genotype- and strain- specific in vitro transcription profiles.
(A) Pair-wise comparison of genes with significant genotype-dependent expression. Includes genes identified by one-way ANOVA of quality-filtered geneset (present in 42 of 48 samples) using Benjamini and Hochberg False Discovery Rate (p<0.01). The matrix of intragenotype comparisons was generated by Tukey post hoc test. The numbers within red squares indicate genes with unique expression patterns between the two intersecting genotypes. (B) Gene tree of select virulence-associate transcriptional regulators with genotype-specific expression signatures. The dosRS two-component regulator, overexpressed in Beijing strains, controls the expression of ∼50 genes in response to multiple signals including nitric oxide, hypoxia, and carbon monoxide and is required for infection in animal models , , , , , , . VirS is overexpressed in EAI strains with concomitant decreased transcript levels of the mymA operon (Rv3083-Rv3089). virS and mymA genes play a role in cell wall ultrastructure and are required for growth in activated macrophages and in mouse spleen , . (C) Gene tree of select loci exhibiting strain-specific expression and profiles shared across multiple genotypes. Expression ratios indicated by color gradient are in vitro log phase transcript levels relative to CDC1551 reference strain (see Fig. 1B for color key).
Figure 3
Figure 3. Long-term survival and growth of MTC clinical isolates in macrophages.
Resting (A–E) and IFN-γ + LPS activated (F–J) murine bone-marrow derived macrophages were infected at low MOI (∼1∶1) with MTC strains. Quantification of viable CFU at day 0,2,4,7, and 11 post-infection were conducted by lysis of monolayers, serial dilution, and plating on 7H10 medium. Error bars indicate standard error of the mean from two independent biological replicates each consisting of three technical replicates per strain (total of 6 wells/strain). Growth profiles of reference strains, H37Rv and CDC1551, are shown in green in all panels. Asterisks in the legend indicate strains determined to exhibit growth profiles significantly different compared to CDC1551 by ANOVA (* = p<0.05, ** = p<0.001). Although EAI strains did not reach p<0.05 when time was modeled as a continuous variable, modeling time as a nominal variable yielded differences of statistical significance at specific time points, indicated by asterisks at day 2 and day 4 in (I).
Figure 4
Figure 4. The MTC universal intracellular transcriptome: identification of genes with conserved expression and regulation inside macrophage phagosome across global panel of MTC clinical isolates.
Global gene expression profiles of 17 MTC strains 24h post-infection of resting and activated macrophages were determined by microarray. Normalized expression ratios for each strain were determined by comparison of RNA from intracellular bacteria versus control bacteria of the same strain treated identically except for phagocytosis by macrophages. This serves to identify relative responses to phagosomal cues rather than inherent strain-dependent differences in gene expression. (A–B) Venn diagrams showing activation-dependent (red = activated, blue = resting) and independent (black) genes with conserved expression patterns across clinical isolates. “Universal genes” were selected based on trending up or down in all strains (up or down >1.2-fold in 15 of 17 strains) and significant induction or repression in >50% of strains (up or down >1.5× in 8 of 17 strains) in each macrophage type. The starting gene list for this analysis included only genes flagged as present in the majority of samples from both macrophage types. (C) Select genes with higher expression levels in activated versus resting macrophages conserved across all or most clinical isolates. Represents subset of activation-dependent genes identified by one-way ANOVA analysis of all intracellular transcription profiles (Benjamini and Hochberg False Discovery Rate p<0.01). (D) Select genes with higher expression in resting versus activated macrophages. See (C) above for analysis description. Refer to Fig 1B for genotype color bar definition (black box denotes reference strain CDC1551).
Figure 5
Figure 5. Lineage-specific transcriptional responses of MTC clinical isolates to macrophage invasion.
(A) Intragenotype comparison of gene expression profiles 24h post-infection of resting macrophages. Scatter plot showing similarity of transcriptome modulation of two M. africanum (genotype West African 2) strains 10514/01 (x-axis) versus 5468/02 (y-axis). (B) Intergenotype comparison of gene expression profiles 24hr post-infection of resting macrophages. Scatter plot showing M. africanum, genotype West African 2 strain 10514/01 (x-axis) versus M. tuberculosis Beijing strain 1934/03 (y-axis). Each spot represents a single gene with expression ratios >1 indicating intracellular induction (red spots) and <1 indicating intracellular repression (blue spots). The degree of similarity in the regulation of a gene between two strains is shown by proximity to the middle diagonal line (ratio = 1). Axes show normalized expression ratio relative to strain-matched extracellular control in a log10 scale. The number of genes with >2-fold differences in intracellular regulation are indicated on the graph. The increased scatter and number of differentially regulated genes seen in strains of different genotypes (B) reflects the diversity of responses to the vacuole environment observed in strains from genetically diverse lineages. Gene trees showing examples genotype- (C), and strain- (D) specific gene regulation after 24h infection of activated macrophages. Refer to Fig 1B for genotype color bar definition (black box denotes reference strain CDC1551).
Figure 6
Figure 6. The additive effect of strain-specific differences in basal in vitro gene expression and transcriptional responses to intracellular cues.
Microarray data from RNA derived from intracellular MTC 24h post-infection were compared directly following median normalization. This allows quantitative estimation of cumulative “absolute” intracellular transcript levels resulting from in vitro differences plus phagosome regulation. (A) Gene tree showing clade-specific intracellular expression levels of putative virulence factors. The narGHJI nitrate reductase operon, implicated in anaerobic nitrate respiration and required for tissue-specific persistence in animal models , , is expressed at lower levels in all clade 2 versus clade 1 strains. The mce4 operon, encoding a cholesterol import system required for growth in activated macrophages and persistence in mouse lungs , is overexpressed in clade 2 strains. (B–D) Reduced expression of sulfolipid (SL), diacyltrehalose (DAT), and polyacyltrehalose (PAT) synthesis genes in intracellular M. africanum West African 2 strains (B) due to lower in vitro expression (B) coupled with lower induction (mmpL8, mmpL10, papA1) or repression (pks4, papA3, pks3) in phagosomes of resting macrophage (C). (E–G) Expression and regulation of DosRS dormancy regulon in MTC clinical isolates. Despite in vitro overexpression of the dosRS two-component regulator in Beijing strains, transcripts of downstream effectors were not notably elevated (E). dosRS and effectors were induced in all strains by phagosomal cues in resting (F) and activated macrophages (data not shown). Although “absolute” levels of dosRS are highest in Beijing strains, DosR-dependent genes are expressed more highly in Haarlem strains (G). Black box in genotype legend denotes reference strain CDC1551. A wider scale for gene expression (0.1–10) was used for (A,D,G).

References

    1. Hershberg R, Lipatov M, Small PM, Sheffer H, Niemann S, et al. High functional diversity in Mycobacterium tuberculosis driven by genetic drift and human demography. PLoS Biol. 2008;6:e311. - PMC - PubMed
    1. Wirth T, Hildebrand F, Allix-Beguec C, Wolbeling F, Kubica T, et al. Origin, spread and demography of the Mycobacterium tuberculosis complex. PLoS Pathog. 2008;4:e1000160. - PMC - PubMed
    1. Sousa AO, Salem JI, Lee FK, Verçosa MC, Cruaud P, et al. An epidemic of tuberculosis with a high rate of tuberculin anergy among a population previously unexposed to tuberculosis, the Yanomami Indians of the Brazilian Amazon. Proceedings of the National Academy of Sciences of the United States of America. 1997;94:13227–13232. - PMC - PubMed
    1. Achtman M. Evolution, population structure, and phylogeography of genetically monomorphic bacterial pathogens. Annu Rev Microbiol. 2008;62:53–70. - PubMed
    1. Alland D, Whittam TS, Murray MB, Cave MD, Hazbon MH, et al. Modeling bacterial evolution with comparative-genome-based marker systems: application to Mycobacterium tuberculosis evolution and pathogenesis. J Bacteriol. 2003;185:3392–3399. - PMC - PubMed

Publication types