

Avalanches in a stochastic model of spiking neurons
- PMID: 20628615
- PMCID: PMC2900286
- DOI: 10.1371/journal.pcbi.1000846
Avalanches in a stochastic model of spiking neurons
Abstract
Neuronal avalanches are a form of spontaneous activity widely observed in cortical slices and other types of nervous tissue, both in vivo and in vitro. They are characterized by irregular, isolated population bursts when many neurons fire together, where the number of spikes per burst obeys a power law distribution. We simulate, using the Gillespie algorithm, a model of neuronal avalanches based on stochastic single neurons. The network consists of excitatory and inhibitory neurons, first with all-to-all connectivity and later with random sparse connectivity. Analyzing our model using the system size expansion, we show that the model obeys the standard Wilson-Cowan equations for large network sizes ( neurons). When excitation and inhibition are closely balanced, networks of thousands of neurons exhibit irregular synchronous activity, including the characteristic power law distribution of avalanche size. We show that these avalanches are due to the balanced network having weakly stable functionally feedforward dynamics, which amplifies some small fluctuations into the large population bursts. Balanced networks are thought to underlie a variety of observed network behaviours and have useful computational properties, such as responding quickly to changes in input. Thus, the appearance of avalanches in such functionally feedforward networks indicates that avalanches may be a simple consequence of a widely present network structure, when neuron dynamics are noisy. An important implication is that a network need not be "critical" for the production of avalanches, so experimentally observed power laws in burst size may be a signature of noisy functionally feedforward structure rather than of, for example, self-organized criticality.
Conflict of interest statement
The authors have declared that no competing interests exist.
Figures
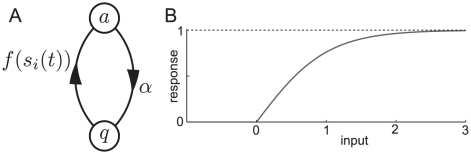
 th neuron, the total synaptic input is the sum of network input and external input,
  . B, graph of the response function
  for
for  .
.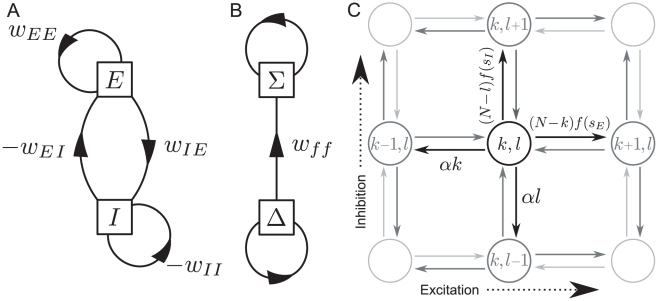
 , and inhibitory,
  , populations, where an arrow indicates a synaptic input. B, schematic of functionally feedforward connectivity, where one mode of network excitation,
  , excites another mode
  , but
, but  does not directly affect
  . C, network dynamics visualized. If there are
  excitatory and
  inhibitory neurons active, another excitatory neuron may become active, and network state moves rightwards one spot, at net rate
  , where
  is the total synaptic input to an excitatory neuron. The rates for other transitions are shown with solid arrows and discussed in the population dynamics section of the results. Dashed arrows represent transitions into the state
  from adjacent states.
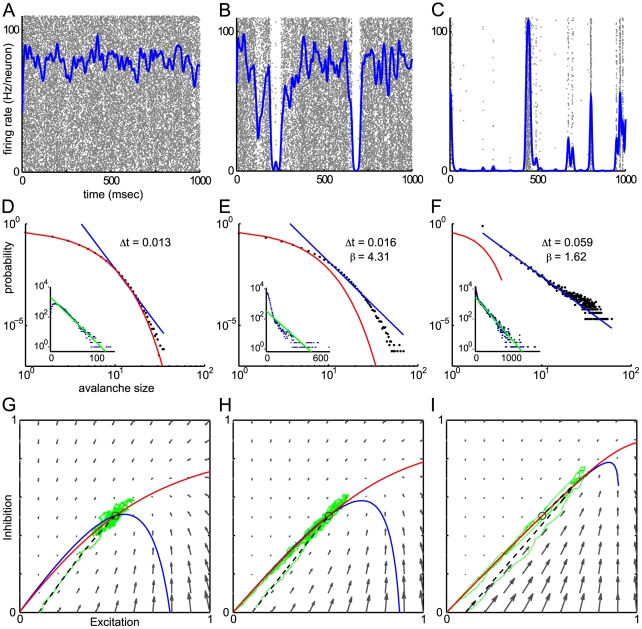
 ,
,  , and
, and  . Left column,
  , middle column,
  , right column
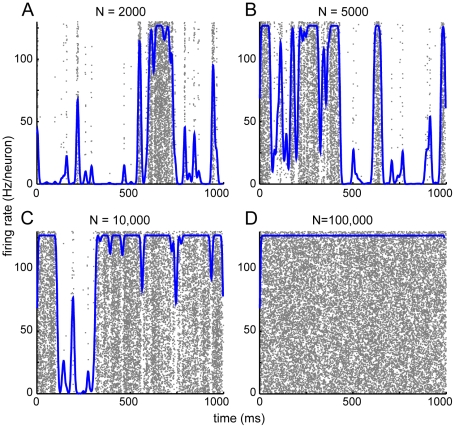
  . A,B,C: Mean firing rate of network (see Procedures) plotted over raster plot of spikes. Individual neurons correspond to rows, and are unsorted except that the lower rows represent excitatory neurons and the upper rows inhibitory. D,E,F: Network burst distribution in number of spikes, together with geometric (red) and power law (blue) fit;
  , the mean inter spike interval, is the time bin used to calculate the distribution, and
  is the exponent of the power law fit. Inset, inter-spike interval (ISI) distribution in
  for a sample of 50 neurons from the network, shown in semi-logarithmic co-ordinates, with exponential fit (green). G,H,I: Phase plane plots of excitatory and inhibitory activity showing the vector field (grey) and nullclines
  (red) and
  (blue), of the associated Wilson-Cowan equations and plots of a deterministic (black dashed) and a stochastic (green) trajectory starting with identical initial conditions. Note that the deterministic fixed point (black circle), where the nullclines cross, does not change as
  increases, but the angle between the nullclines becomes increasingly shallow, and the stochastic trajectory becomes increasingly spread out. See also figure S1.
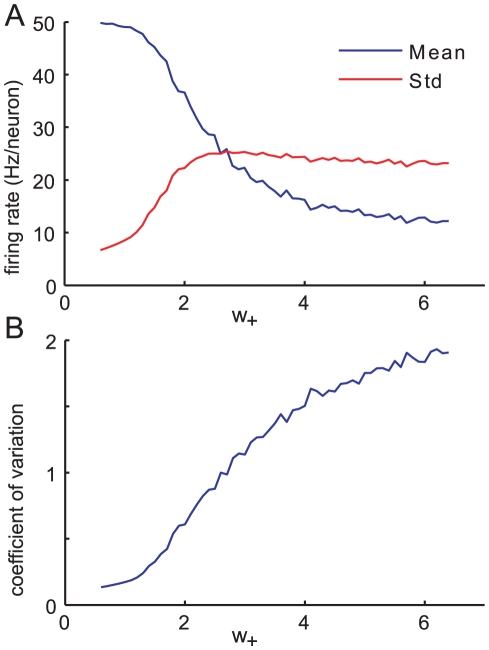
 , from simulations with other parameters fixed,
  ,
,  and
and  . The timebin width is
  . Note that the feedforward strength
  is proportional to the sum of weights,
  .
.
 , with other parameters fixed as
  ,
,  ,
,  . A: N = 2000. B: N = 5000. C: N = 10,000. D: N = 100,000.
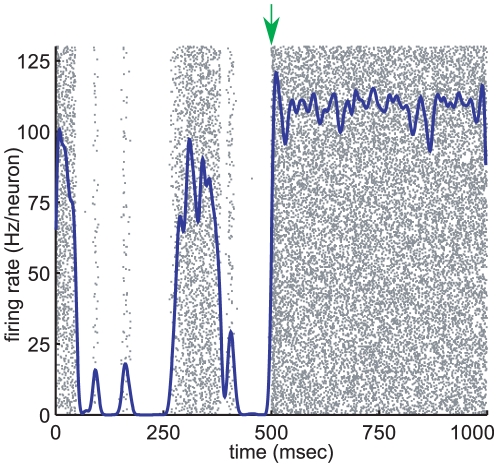
 for the first 500ms and
  for the following 500ms; the change is indicated by the green arrow. The other parameters for this all-to-all network are,
  ,
,  , and
, and  .
.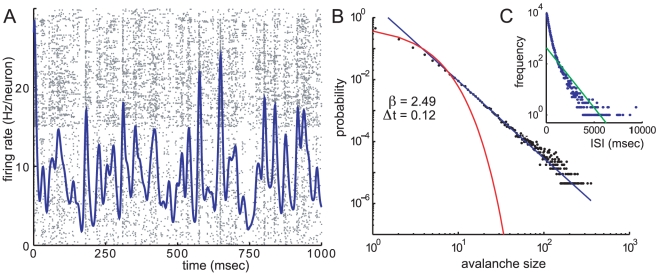
 , with 17% connectivity. See text for details of sparse weight matrix. A: Raster plot and mean firing rate. B: Avalanche size distribution, calculated with bin size
  and showing poisson fit (red) and power law fit (blue) with exponent
  . C: Inter-spike-interval distribution with exponential fit (green).
References
-
- Pasquale V, Massobrio P, Bologna L, Chiappalone M, Martinoia S. Self-organization and neuronal avalanches in networks of dissociated cortical neurons. Neuroscience 2008 - PubMed
Publication types
MeSH terms
LinkOut - more resources
Full Text Sources
