. 2010 Jul 7;5(7):e11454.
doi: 10.1371/journal.pone.0011454.

Divergent cortical generators of MEG and EEG during human sleep spindles suggested by distributed source modeling

Affiliations

Divergent cortical generators of MEG and EEG during human sleep spindles suggested by distributed source modeling

Nima Dehghani et al. PLoS One. .

Abstract

Background: Sleep spindles are approximately 1-second bursts of 10-15 Hz activity, occurring during normal stage 2 sleep. In animals, sleep spindles can be synchronous across multiple cortical and thalamic locations, suggesting a distributed stable phase-locked generating system. The high synchrony of spindles across scalp EEG sites suggests that this may also be true in humans. However, prior MEG studies suggest multiple and varying generators.

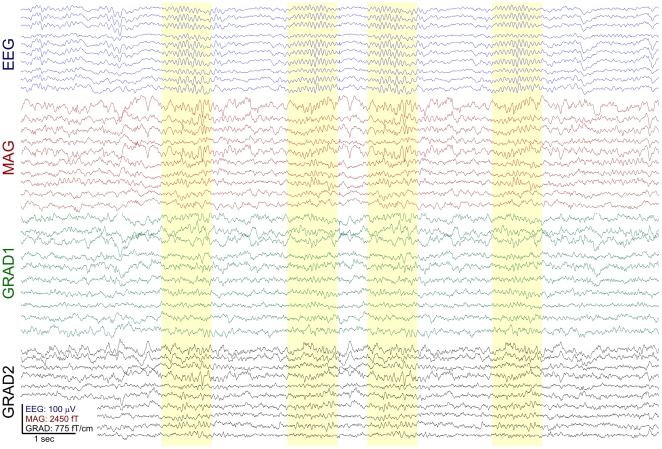
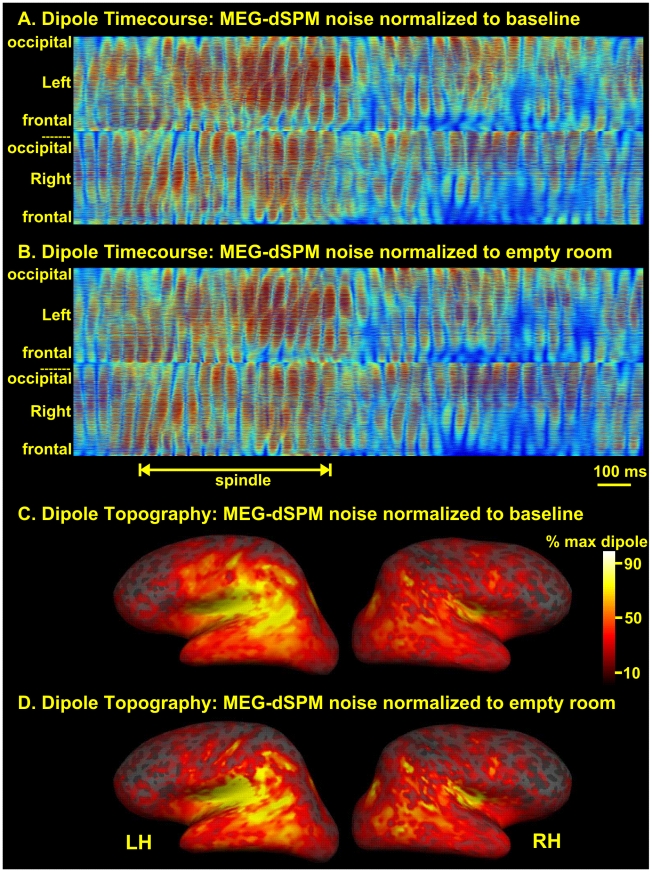
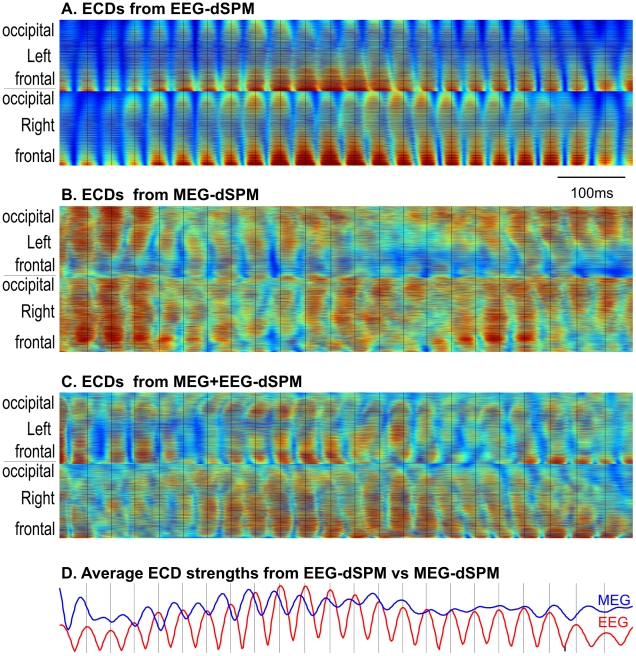
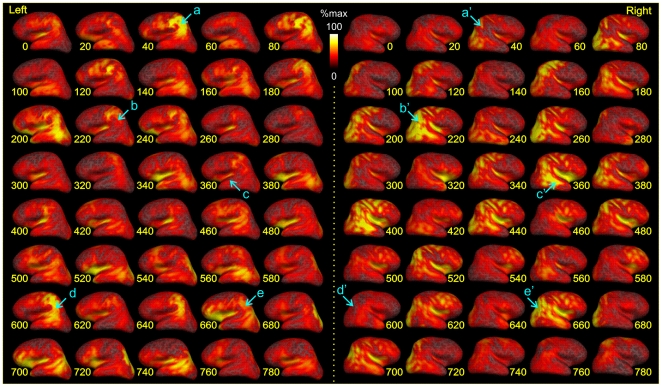
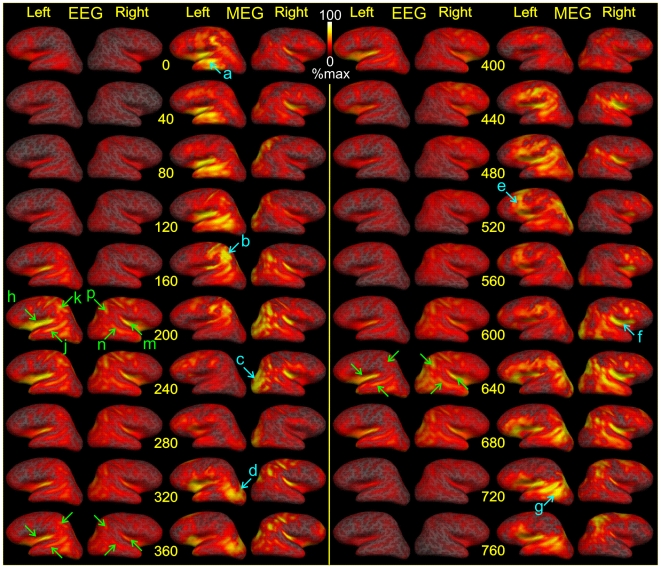
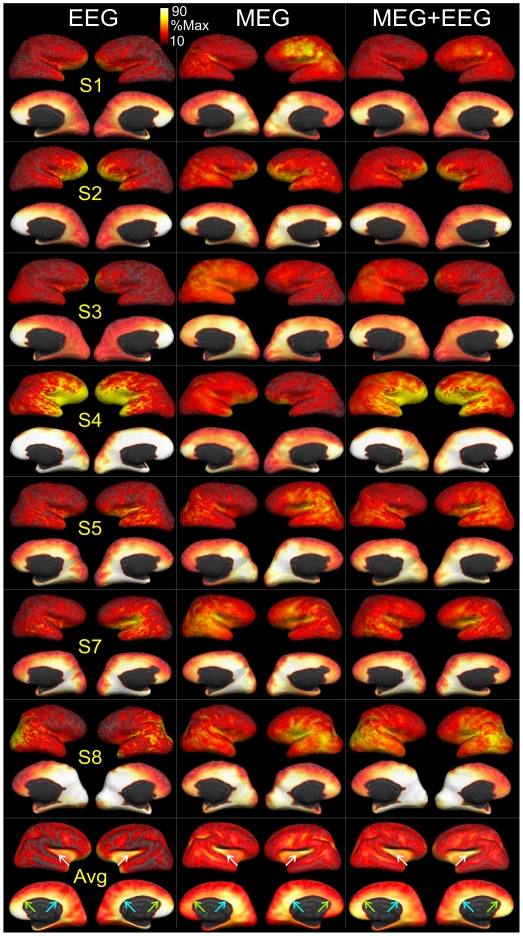
Methodology/principal findings: We recorded 306 channels of MEG simultaneously with 60 channels of EEG during naturally occurring spindles of stage 2 sleep in 7 healthy subjects. High-resolution structural MRI was obtained in each subject, to define the shells for a boundary element forward solution and to reconstruct the cortex providing the solution space for a noise-normalized minimum norm source estimation procedure. Integrated across the entire duration of all spindles, sources estimated from EEG and MEG are similar, diffuse and widespread, including all lobes from both hemispheres. However, the locations, phase and amplitude of sources simultaneously estimated from MEG versus EEG are highly distinct during the same spindles. Specifically, the sources estimated from EEG are highly synchronous across the cortex, whereas those from MEG rapidly shift in phase, hemisphere, and the location within the hemisphere.

Conclusions/significance: The heterogeneity of MEG sources implies that multiple generators are active during human sleep spindles. If the source modeling is correct, then EEG spindles are generated by a different, diffusely synchronous system. Animal studies have identified two thalamo-cortical systems, core and matrix, that produce focal or diffuse activation and thus could underlie MEG and EEG spindles, respectively. Alternatively, EEG spindles could reflect overlap at the sensors of the same sources as are seen from the MEG. Although our results generally match human intracranial recordings, additional improvements are possible and simultaneous intra- and extra-cranial measures are needed to test their accuracy.


Conflict of interest statement

Competing Interests: The authors have declared that no competing interests exist.

Figures

Figure 1
Figure 1. Example spindles.
Selected spindles in sample EEG and MEG channels are highlighted in yellow. Complete recording profiles are shown in Figure S1.
Figure 2
Figure 2. Comparison of source localization using different noise estimates.
A. Spindle MEG-dSPM normalized with noise covariance calculated from averages of sleep epochs lacking grapho-elements. Normalized dipole strength for each of 6500 cortical dipoles is plotted as a horizontal line; red is high activity. B. MEG-dSPM from the same spindle, but normalized with noise estimates from empty room recordings. C, D. The activity shown in panels A and B were averaged over the course of the spindle and plotted on the reconstructed cortical surface of this subject. Very similar cortical activity patterns were inferred using the baseline (C) as compared to the empty room (D) noise covariance calculations.
Figure 3
Figure 3. Source space electromagnetic profile of sleep spindles.
Time-intensity plots of square root of dSPM F-statistics across all 6500 cortical locations as estimated for EEG-dSPM (panel A), MEG-dSPM (B) or both modalities (MEG+EEG-dSPM, panel C). Thin black vertical lines at the peaks of the EEG spindles are extended across all panels, showing that they are not aligned with the peaks of the MEG spindles. ECDs from EEG are highly synchronous across the cortex, whereas ECDs from MEG and M/EEG are rapidly shifting in phase, hemisphere, and the location within the hemisphere. ECD power at each time point averaged across all ECDs is shown in D. Coherence of these measures between EEG and MEG for this spindle was 0.7. For another example from another subject, see Figure S2.
Figure 4
Figure 4. Dynamic spatiotemporal patterns of spindling.
A combined MEG+EEG-dSPM solution is mapped on cortical surface throughout the duration of an example spindle. Each row shows 100 ms of left (on left) and right (on right) hemisphere activation maps with 20 ms delays between two consecutive snapshots. Note the variety of patterns for successive spindle waves within the same spindle discharge. For example, at 40 ms the spindle is estimated to arise mainly in the left parietal lobe (see blue arrow marked with an a), at 220 ms, right occipitotemporal (b'), and at 360 right temporal and perisylvian (c') with relatively little contralateral activity (a', b, c). Later, at around 600 ms, maximal activity returns to left parietal (d) then around 660 shifts to the right hemisphere (e') and so on. Estimated ECD strength is plotted on the subject's cortex after expansion to reveal sulcal as well as gyral cortex. Subj. 5.
Figure 5
Figure 5. Dynamic spatiotemporal patterns of spindling.
Contrasting dSPM solutions from MEG and EEG to simultaneous data, as mapped on cortical surface throughout the duration of a spindle. Time proceeds from top to bottom in each column, with successive snapshots separated by 40 ms. The left 4 columns show activity from 0 to 360 ms, and the right 4 columns from 400 to 760 ms, of the same spindle discharge. Note that activation peaks are not synchronous in MEG and EEG, nor are they in the same locations. MEG is highly variable across time, with successive peaks of activity (see blue arrows) in left temporal at 0 ms (a), left parietal at 160 (b), right occipital at 240 (c), left occipital at 320 (d), left frontal at 520 (e), right insula at 600 (f), and left occipitotemporal at 720 (g). In contrast, EEG-derived source localizations appear more bilaterally symmetrical and consistent over time. For example, at 200 ms, relatively high activation is estimated to the left and right insula (h, m), superior temporal sulcus (j, n), and parietal lobe (k, p). Very similar activation is seen at 360 and 640 ms (see green arrows). Estimated ECD strength is plotted on the subject's cortex after expansion to reveal sulcal (dark gray) as well as gyral (light gray) cortex.
Figure 6
Figure 6. Maps of average estimated cortical activation during spindles.
Activity was estimated with dSPM using EEG, MEG or combined EEG and MEG (MEG+EEG) data. For each spindle and modality, a map was made of the maximum activity during that spindle at each of ∼6500 cortical locations. These maps were then averaged across all spindles from that subject, normalized to the maximum value, and displayed below on the expanded cortical surface. The subject-specific cortical maps were then averaged together and plotted at the bottom of the figure. All subjects and modalities show maximal activity in medial cortex, varying across subjects between more anterior (green arrows, bottom row) and posterior (blue arrows) regions. Lateral activity is weaker and includes the insula (white arrows) and all lobes. The site of maximum lateral activity varies across subjects between frontal, parietal and temporal lobes.

References

    1. Loomis AL, Harvey EN, Hobart G. Potential rhythms of cerebral cortex during sleep. Science. 1935;81:597–598. - PubMed
    1. Gibbs FA, Gibbs EL. Cambridge: Addison-Wesley Press; 1950. Atlas of Electroencephalography.
    1. Zepelin H, Siegel JM, Tobler I. Mammalian sleep. In: Kryger MH, Roth T, Dement WC, editors. Principles and Practice of Sleep Medicine. London: Saunders; 1994. pp. 91–100.
    1. Andersen P, Andersson SA. New York: Meredith Corp; 1968. Physiological basis of the alpha rhythm.
    1. Spencer WA, Brookhart JM. A study of spontaneous spindle waves in sensorimotor cortex of cat. J Neurophysiol. 1961;24:50–65.

Publication types