. 2010 Sep;212(1):59-72.
doi: 10.1007/s00213-010-1924-6. Epub 2010 Jul 14.

Imaging brain regional and cortical laminar effects of selective D3 agonists and antagonists

Affiliations

Imaging brain regional and cortical laminar effects of selective D3 agonists and antagonists

Ji-Kyung Choi et al. Psychopharmacology (Berl). 2010 Sep.

Abstract

Rationale: Dopamine D3 receptors (D3R) may be important therapeutic targets for both drug abuse and dyskinesias in Parkinson's disease; however, little is known about their functional circuitry.

Objectives: We wished to determine if D3R antagonists SB-277011 and PG-01037 and D3R-preferring agonist 7-OH-DPAT are D3R selective in vivo. We further wished to characterize the response to D3R drugs using whole brain imaging to identify novel D3R circuitry.

Methods: We investigated D3R circuitry in rats using pharmacologic MRI and challenge with selective D3R antagonists and agonist at various doses to examine regional changes in cerebral blood volume (CBV). We compared regional activation patterns with D2R/D3R agonists, as well as with prior studies of mRNA expression and autoradiography.

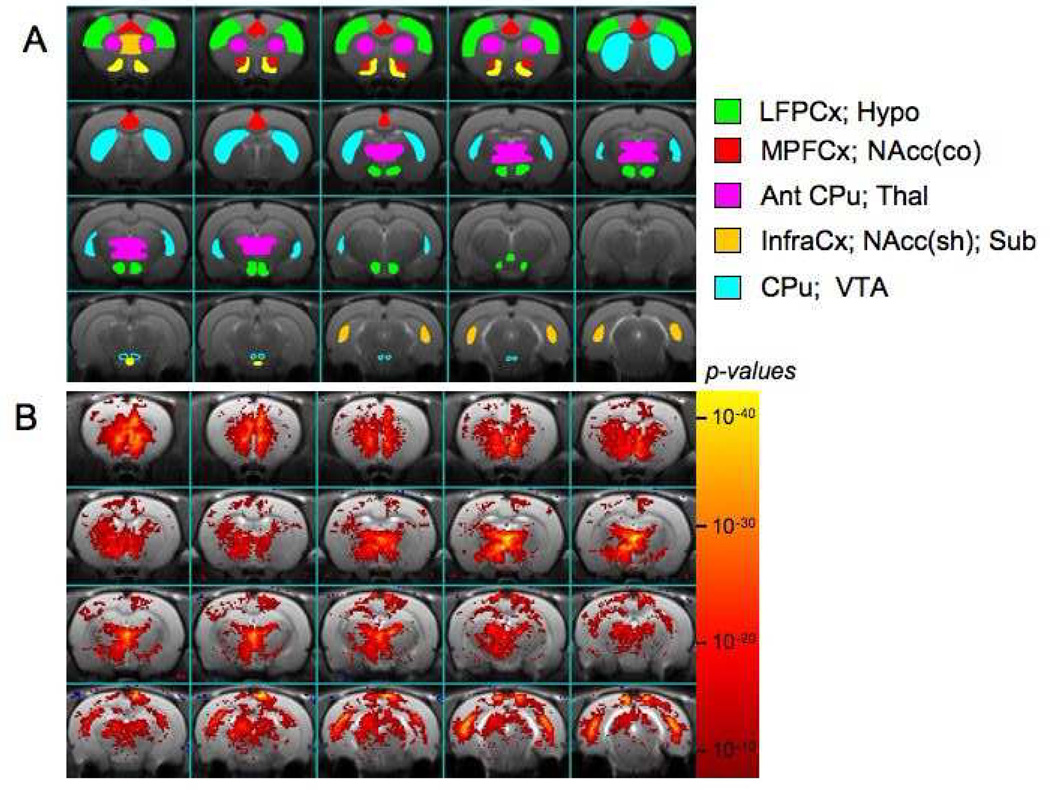
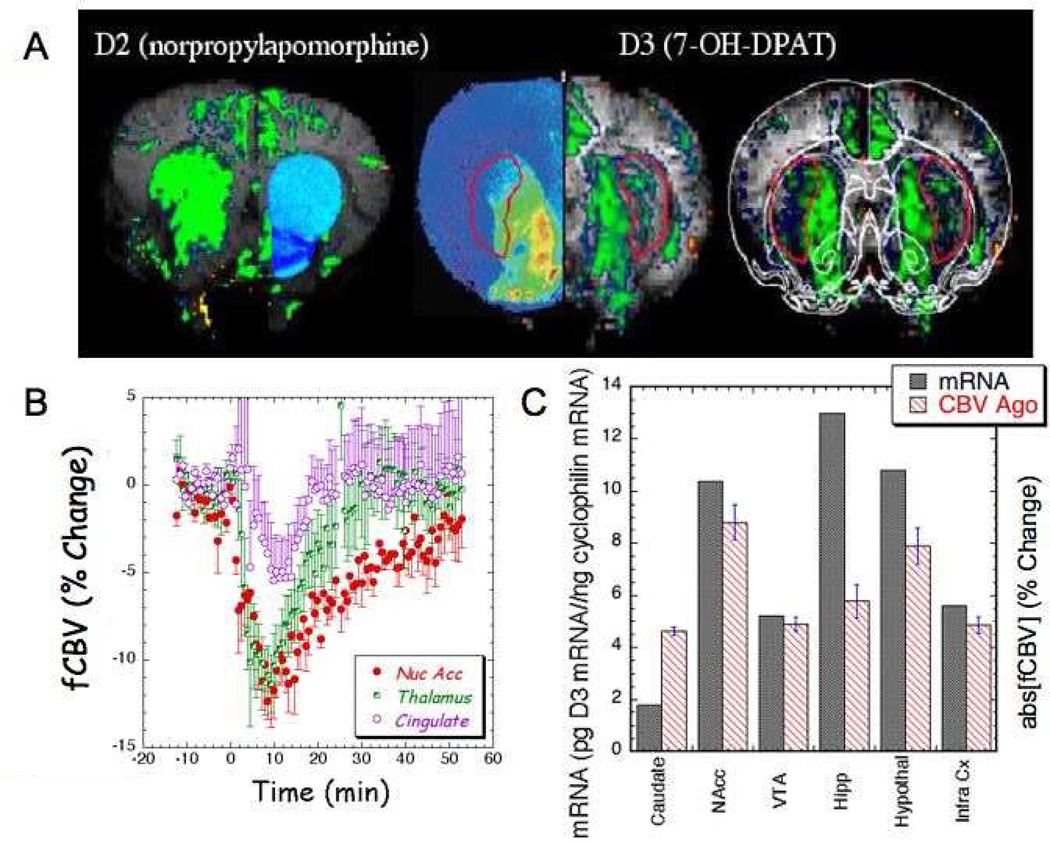
Results: D3R antagonists induced positive CBV changes and D3R agonist negative CBV changes in brain regions including nucleus accumbens, infralimbic cortex, thalamus, interpeduncular region, hypothalamus, and hippocampus (strongest in subiculum). All D3R-preferring drugs showed markedly greater responses in nucleus accumbens than in caudate/putamen consistent with D3R selectivity and contrary to what was observed with D2R agonists. At high doses of D3R agonist, functional changes were differentiated across cortical laminae, with layer V-VI yielding positive CBV changes and layer IV yielding negative CBV changes. These results are not inconsistent with differential D1R and D3R innervation in these layers respectively showed previously using post-mortem techniques.

Conclusions: MRI provides a new tool for testing the in vivo selectivity of novel D3R dopaminergic ligands where radiolabels may not be available. Further, the functional D3R circuitry strongly involves hypothalamus and subiculum as well as the limbic striatum.


Figures

Fig. 1
Fig. 1
Maps of D3 antagonist PG-01037. A) The regions of interest (ROIs) used in the quantitative analysis are shown on a high resolution T2 image to which all the brains were registered. B) Average map of statistically significant changes in fCBV induced by 2.6 mg/kg of PG-01037 (n=13) using a fit to a general linear model. Numerous brain regions show a strong response, but there is a much larger response in the shell of the accumbens than in the caudate/putamen indicating the high D3 selectivity of this compound.
Fig. 2
Fig. 2
Selectivity in the nucleus accumbens in the response to PG-01037. A) Three slices from a study of 2mg/kg of PG-01037 with a registered brain atlas showing the nucleus accumbens in green and the caudate/putamen in blue. There is a gradient in the caudate/putamen such that there is greater activation in the anteromedial CPu than in the posterior-lateral CPu. B) Average CBV time course for 2.6mg/kg (n=13) of PG-01037 in the nucleus accumbens shell. The CBV change is still elevated at 80 min after i.v. administration. C) Comparison of the average fCBV change over the first 40 min after PG-01037 with mRNA expression of D3R measured by Richtand et al. (Richtand et al., 1995). Just by sheer chance the absolute magnitude of the two metrics agree in the NAc. The overall pattern is similar indicating good D3 selectivity for the PG-01037. D) Although most brain regions did not show a significant effect of dose using ANOVA analysis, the doses can be separated using the averaged CBV values over 40min across brain regions using linear discriminant analysis. The two discriminant functions are plotted with the percent of variance in the data they explained. Function 1 was significant by Wilk’s lamba (p = 0.013) whereas function 2 was not (p = 0.47).
Fig. 3
Fig. 3
Maps of D3 antagonist SB-277011A. A) Map of statistically significant changes in fCBV after administration of 10mg/kg i.p. of the D3 antagonist SB-277011A. There is a large response in NAc and little in the CPu. In contrast to the PG-01037 the largest response is in the medial prefrontal cortex. B) Averaged fCBV response after i.p. administration of SB-277011A (n=7). The signal has returned to baseline after approximately 40min.
Fig. 4
Fig. 4
Maps of responses to two doses of the D3 agonist 7-OH-DPAT. A) Averaged map of statistically significant fCBV changes to 0.1 mg/kg of 7-OH-DPAT (n=4). The largest responses are noted in the NAc and the anteromedial CPu. B) Averaged map of statistically significant fCBV changes to 0.5 mg/kg of 7-OH-DPAT (n=5). There is a greater response in numerous regions of the brain reflecting the large dose dependence noted with this drug compared to the D3 antagonist.
Fig. 5
Fig. 5
Comparisons of D3 agonist maps to autoradiography and D2 agonist. A) On the top left is a map of significant changes in CBV induced by 2mg/kg of the D2 agonist norpropylapomorhine compared to an overlay from D2 autoradiography. Data is taken from (Choi et al., 2006). In the middle is a comparison of the fCBV response to 0.2mg/kg of 7-OHDPAT in a single animal to an autoradiogram taken using labeled 7-OH-DPAT by Neisewander et al. (Neisewander et al., 2004) with permission of the publisher. The autoradiogram (left side of image) was scanned from the paper by Neisewander et al. and aligned as best as possible to the MRI. The CPu is shown in the red outline showing the large gradient from NAc to CPu. On the right is the CBV map shown with an outline of a registered rat atlas (Paxinos and Watson, 1986). B) Averaged time course of fCBV changes induced by 0.25 mg/kg 7-OH-DPAT (n=10). Note the fCBV changes are negative compared to the positive changes induced by D3 antagonism. C) Comparison of the absolute value of the average fCBV change over the first 30 min after 7-OH-DPAT with mRNA expression of D3R measured by Richtand et al. (Richtand et al., 1995).
Fig. 6
Fig. 6
Cortical layer specificity of high doses of 7-OH-DPAT. A) Figure taken from Fig. 2a of Gurevich and Joyce (Gurevich and Joyce, 2000) with permission of the publisher. On the top left the left hemisphere shows specific binding to D3R and the right hemisphere is the mRNA expression of D3R. Both are greatest in layer IV of cortex. On the top right is a figure taken from Fig. 8 of (Gurevich and Joyce, 2000) showing the layer specificity of D1R mRNA expression in layers V–VI of cortex. B) Averaged map (n=5) of CBV changes induced by 1.5 mg/kg of 7-OH-DPAT. Note the large activation in basal ganglia and the negative D3-like CBV in layers III–IV and the postive D1-like CBV changes in layers V–VI. C) Averaged CBV time course for activation in layers IV and V for 1.5mg/kg 7-OH-DPAT. D) Plot of the fCBV values as a function of distance normal to the cortical surface. The values represent the averages over a 1mm slice interval from bregma (+1.2-0.2) and the identification of the layers follows that drawn in the Paxinos and Watson atlas (Paxinos and Watson, 1998).
Fig. 7
Fig. 7
Interactions of D3 agonist and antagonist. A) Subtraction map of CBV changes induced by 3 mg/kg of PG-01037 in the first 30 minutes followed by 0.2mg/kg of 7-OH-DPAT in the following 30 min. Since the subtraction is a positive CBV change minus a negative CBV change the result is positive and is essentially a conjunction map of the two drugs. The strongest effects were seen in the NAc, medial hypothalamus and interpeduncular regions. B) Plot of the averaged fCBV timecourse from the NAc. The agonist immediately turns off the antagonist. C) A bar graph of the brain regional effects of the antagonist preceded by the agonist (n=5). The agonist at this dose (0.2mg/kg) blocks the antagonist (3 mg/kg) in most brain regions. D) A bar graph of the regional effects of the antagonist first (3mg/kg) upon the agonist (0.2mg/kg) (n=5). At this dose the antagonist does not block the effects of the agonist in most brain regions. *** P< 0.001; ** p<0.01; * p<0.05. Cing – anterior cingulate; VMH ventromedial hypothalamus; VMStr medial caudate/putamen; Shell – shell of the NAc; LFPCx – lateral frontoparietal cortex.

References

    1. Ahlenius S, Salmi P. Behavioral and biochemical effects of the dopamine D3 receptor-selective ligand, 7-OH-DPAT, in the normal and the reserpine-treated rat. Eur J Pharmacol. 1994;260:177–181. - PubMed
    1. Andreoli M, Tessari M, Pilla M, Valerio E, Hagan JJ, Heidbreder CA. Selective antagonism at dopamine D3 receptors prevents nicotine-triggered relapse to nicotine-seeking behavior. Neuropsychopharmacology. 2003;28:1272–1280. - PubMed
    1. Aretha CW, Galloway MP. Dopamine autoreceptor reserve in vitro: possible role of dopamine D3 receptors. Eur J Pharmacol. 1996;305:119–122. - PubMed
    1. Attwell D, Iadecola C. The neural basis of functional brain imaging signals. Trends Neurosci. 2002;25:621–625. - PubMed
    1. Baker LE, Hood CA, Heidema AM. Assessment of D3 versus D2 receptor modulation of the discriminative stimulus effects of (+)-7-OH-DPAT in rats. Behav Pharmacol. 1999;10:717–722. - PubMed

Publication types

MeSH terms

LinkOut - more resources