. 2010 Oct;49(10):948-62.
doi: 10.1002/gcc.20807.

Identification of primary gene targets of TFAP2C in hormone responsive breast carcinoma cells

Affiliations

Identification of primary gene targets of TFAP2C in hormone responsive breast carcinoma cells

George W Woodfield et al. Genes Chromosomes Cancer. 2010 Oct.

Abstract

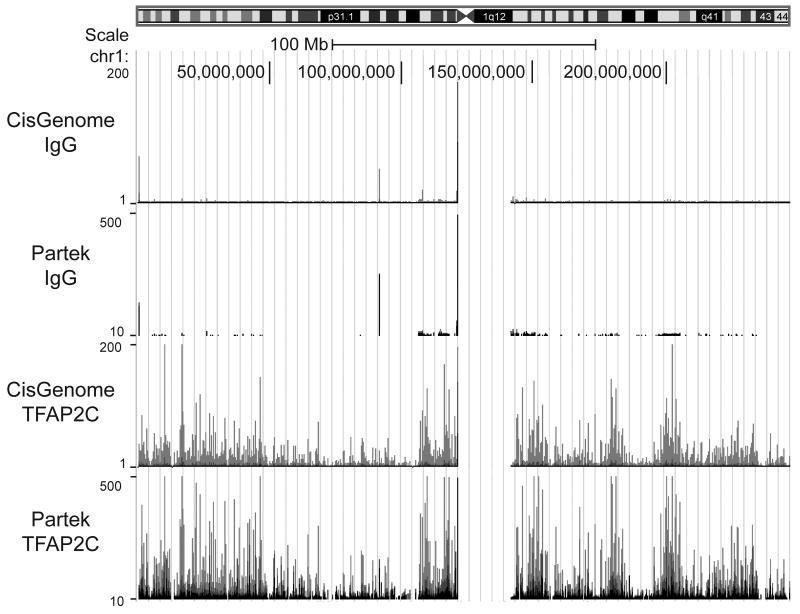
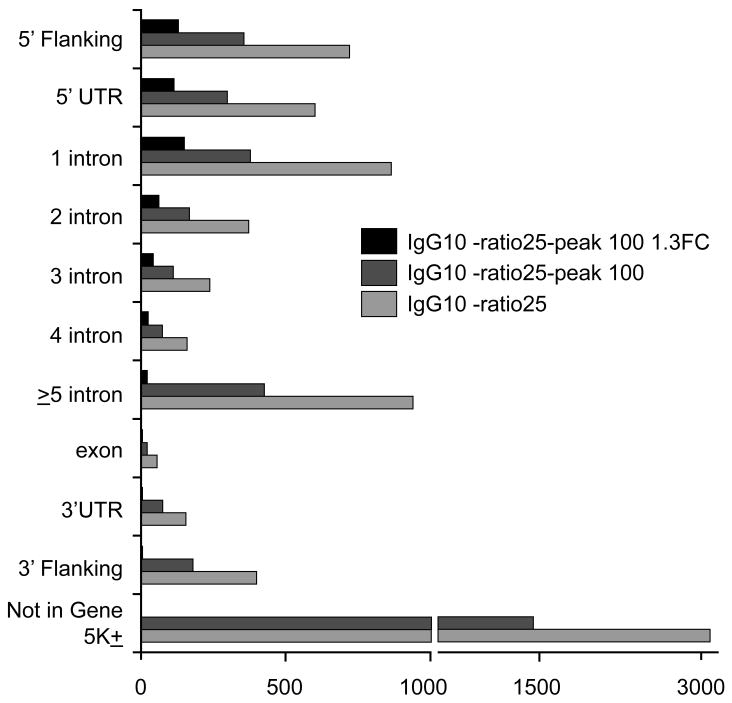
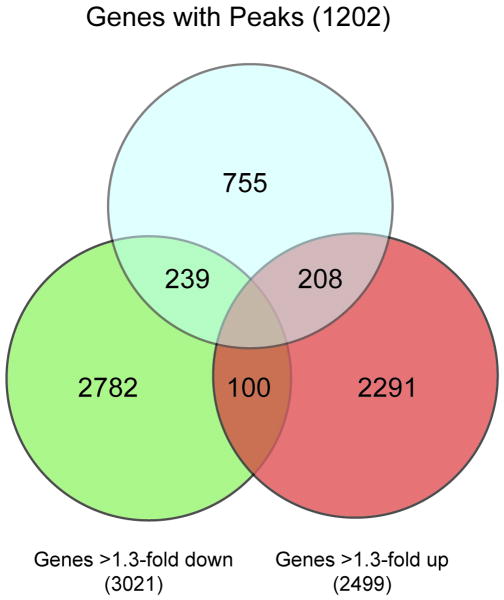
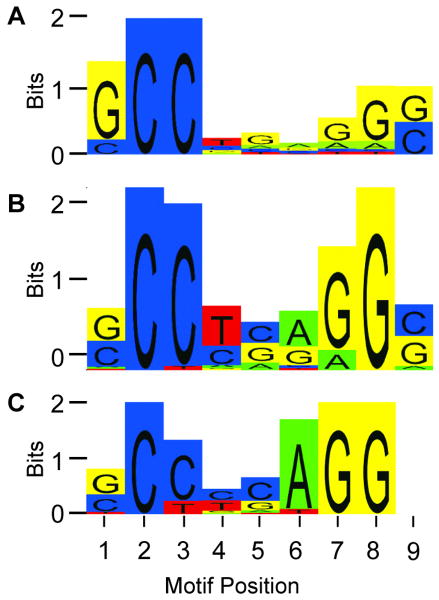
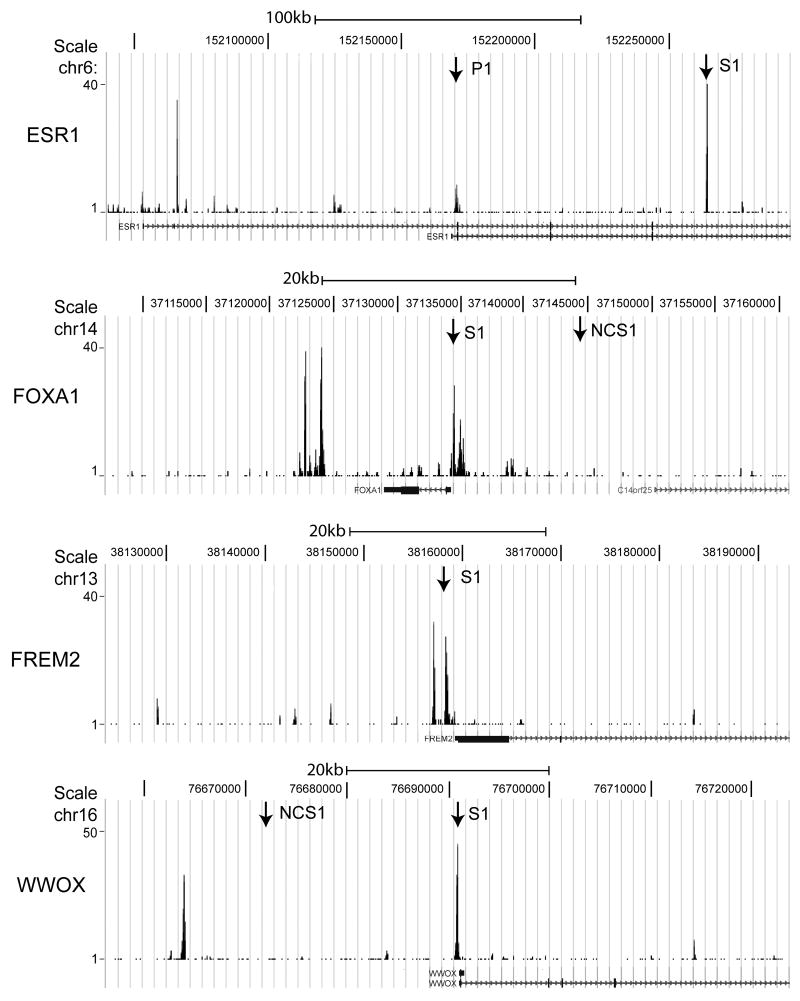
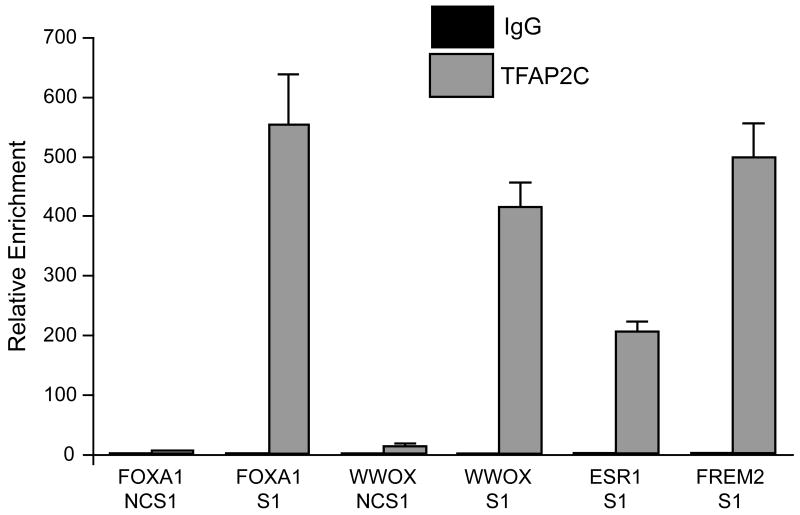
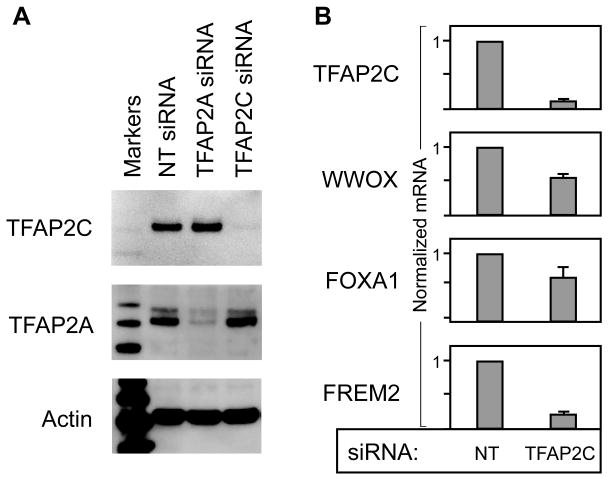
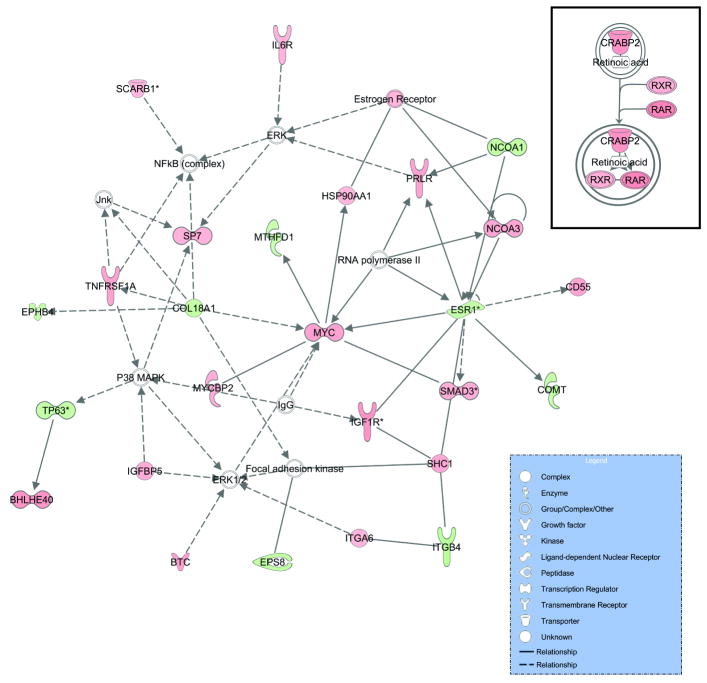
The TFAP2C transcription factor is involved in mammary development, differentiation, and oncogenesis. Previous studies established a role for TFAP2C in the regulation of ESR1 (ERalpha) and ERBB2 (Her2) in breast carcinomas. However, the role of TFAP2C in different breast cancer phenotypes has not been examined in detail. To develop a more complete characterization of TFAP2C target genes, ChIP-seq with anti-TFAP2C antibody and expression arrays with TFAP2C knock down were analyzed in MCF-7 breast carcinoma cells. Genomic sequences common to the ChIP-seq data set defined the consensus sequence for TFAP2C chromatin binding as the nine base sequence SCCTSRGGS (S = G/C, r = A/G), which closely matches the previously defined optimal in vitro binding site. Comparing expression arrays before and after knock down of TFAP2C with ChIP-seq data demonstrated a conservative estimate that 8% of genes altered by TFAP2C expression are primary target genes and includes genes that are both induced and repressed by TFAP2C. A set of 447 primary target genes of TFAP2C was identified, which included ESR1 (ERalpha), FREM2, RET, FOXA1, WWOX, GREB1, MYC, and members of the retinoic acid response pathway. The identification of ESR1, WWOX, GREB1, and FOXA1 as primary targets confirmed the role of TFAP2C in hormone response. TFAP2C plays a critical role in gene regulation in hormone responsive breast cancer and its target genes are different than for the Her2 breast cancer phenotype.


Figures

Figure 1
Figure 1. Visual Display of Peaks from Chromosome 1
Diagram of chromosome 1 with scale showing 100 Mb size marker (along top) with Genome Browser display of peaks (beneath) derived from CisGenome (panels one and three) or Partek (panels two and four) for data from ChIP-seq derived from immunoprecipitations performed with either IgG (panels one and two) or anti-TFAP2C (panels three and four). Vertical axis for each panel is approximately equal to number of sequence reads at each location. Horizontal axis is relative location along chromosome 1. Note similarity of output derived from CisGenome or Partek. The ChIP-seq dataset is accessible through GEO Series accession number GSE21234.
Figure 2
Figure 2. Distribution of ChIP-Seq Peaks Relative to Gene Location
Number of peaks identified from ChIP-Seq analysis based on analysis using Partek with varying criteria. IgG10-ratio25: number of peaks from criteria examining <10 reads in the IgG control and ratio between number of reads in the TFAP2C experiment over reads in the IgG control ≥ 25. IgG10-ratio25-peak100: uses the additional criteria of filter with TFAP2C ‘peak’ output ≥ 100. IgG10-ratio25-peak100 1.3FC: adds the additional criterion based on finding a 1.3 fold change in expression after knock down of TFAP2C expression. All data is presented relative to gene location as shown. The criterion of “Not in gene” is based on peaks farther then 5 kbp from a defined gene.
Figure 3
Figure 3. Summary of TFAP2C Gene Peaks and Expression Array
Venn diagram summarizes the number of genes with identified binding peaks for TFAP2C binding to regions of defined genes compared to expression array data demonstrating increase or decrease of greater than 1.3-fold change with knock-down of TFAP2C using siRNA. A total of 447 target genes were identified with binding peaks from anti-TFAP2C ChIP with peaks defined by Partek from ChIP-seq data set and greater than 1.3 fold changes with TFAP2C knock down. There were 100 genes that demonstrated greater than 1.3-fold change in gene expression but were not associated with a peak in ChIP-seq, but whose expression pattern could not be unambiguously assigned to either the increase or decrease category. The ambiguity was due to genes with multiple probes on the expression array with discordant expression findings. A total of 3021 genes decreased by 1.3-fold or more and 2499 genes increased by 1.3-fold or more following knock-down of with siRNA directed against TFAP2C.
Figure 4
Figure 4. Sequence Logo of TFAP2C Consensus Motifs
The motif of the TFAP2C consensus binding site indicates a 9-bp consensus element. Vertical axis (Bits) indicates the information content of the base frequency at that position. Positions that are perfectly conserved contain 2 bits of information, those with two possible nucleotides with 50% frequency equal 1 bit and if all four bases occur equally, the value is zero, since no base preference is demonstrated (D'Haeseleer 2006). The horizontal axis refers to consensus site position (1 through 9). A. The sequence logo motif of the TFAP2C consensus binding site derived from in vitro site selection as previously reported (McPherson and Weigel 1999). B. The consensus logo motif derived using Partek analysis of ChIP-seq data from the 527 peaks derived from 447 TFAP2C target genes that demonstrated >1.3-fold expression change. C. Motif logo derived from ChIP-seq data from 1384 peaks that were included regardless of transcriptional effect on gene with TFAP2C knock-down.
Figure 5
Figure 5. Graphical Display of TFAP2C Binding Peaks for Selected Genes
Shown is the graphical display from Genome Browser for the ChIP-seq data performed with anti-TFAP2C antibody for four TFAP2C target genes. First panel: approximately 250 kbp region of the ESR1 gene chromosomal region showing peaks representing TFAP2C binding. Arrows denote regions chosen for detailed analysis corresponding to binding peaks (ESR1 S1) and site of previous TFAP2C binding site identified (ESR1 P1). Second panel: Approximately 50 kbp chromosomal region of the FOXA1 gene showing region with significant TFAP2C binding (FOXA1 S1) and location chosen as negative control site (FOXA1 NCS1). Third panel: Approximately 60 kbp chromosomal region for the FREM2 gene showing location of the TFAP2C binding peaks near the transcriptional start site (FREM2 S1). Fourth panel: Approximately 60 kbp of the WWOX gene showing location of the TFAP2C binding peak near the transcriptional start site (WWOX S1) and the location of a negative control site (WWOX NCS1).
Figure 6
Figure 6. Conventional ChIP Analysis for Selected TFAP2C Binding Sites
Conventional ChIP analysis was performed using primer pairs in the regions defined by TFAP2C binding locations displayed in Figure 5. Real-time qPCR was used to amplify chromatin derived from immunoprecipitations with either IgG or anti-TFAP2C antibody as indicated. (Note: the data is normalized to IgG and bar graph with value of 1 is not well visualized). Amplification with each primer pair was normalized to input chromatin and values subsequently normalized to values derived from IgG ChIP with data reported as relative enrichment. Data demonstrate significant relative enrichment at each TFAP2C binding site identified by ChIP-seq (FOXA1 S1, WWOX S1, ESR1 S1 and FREM2 S1) and minimal binding for negative control sites (FOXA1 NCS1, WWOX NCS1).
Figure 7
Figure 7. Confirmation of Gene Expression at Selected Genes
A. Western blot of protein prepared from MCF-7 cells 72 hours after transfection with the siRNA indicated; NT siRNA: Non-targeting siRNA, TFAP2A siRNA or TFAP2C siRNA. Each blot is probed with antibody indicated and demonstrates knock-down of either TFAP2C or TFAP2A appropriately with transfection of related siRNA with approximately equal protein loading indicated by Actin blot. B. Real-time RT-PCR of mRNA expression for the genes indicated, which demonstrates successful knock-down of TFAP2C and corresponding decrease in expression of WWOX, FOXA1 and FREM2 with TFAP2C siRNA compared to transfection with NT siRNA. Data reported as normalized mRNA expression for the gene indicated.
Figure 8
Figure 8. Pathway Associations of TFAP2C Target Genes
The 447 TFAP2C target genes were analyzed using Ingenuity Systems to determine associations between genes for the purpose of defining physiologic pathways regulated by TFAP2C. The main pathway (with the greatest number of genes) is shown and was characterized as involved in cell growth and proliferation. Prominent genes noted in this network include MYC, ESR1 and ERK. Red tone indicates genes repressed by TFAP2C and green indicates genes induced by TFAP2C. Inset: Retinoic acid signaling pathway was also identified as a prominent network involved with TFAP2C target genes, RXR, RAR and CRABP2.

References

    1. Ailan H, Xiangwen X, Daolong R, Lu G, Xiaofeng D, Xi Q, Xingwang H, Rushi L, Jian Z, Shuanglin X. Identification of target genes of transcription factor activator protein 2 gamma in breast cancer cells. BMC Cancer. 2009;9:279. - PMC - PubMed
    1. Albergaria A, Paredes J, Sousa B, Milanezi F, Carneiro V, Bastos J, Costa S, Vieira D, Lopes N, Lam EW, Lunet N, Schmitt F. Expression of FOXA1 and GATA-3 in breast cancer: the prognostic significance in hormone receptor-negative tumours. Breast Cancer Res. 2009;11:R40. - PMC - PubMed
    1. Allouche A, Nolens G, Tancredi A, Delacroix L, Mardaga J, Fridman V, Winkler R, Boniver J, Delvenne P, Begon DY. The combined immunodetection of AP-2alpha and YY1 transcription factors is associated with ERBB2 gene overexpression in primary breast tumors. Breast Cancer Res. 2008;10:R9. - PMC - PubMed
    1. Begon DY, Delacroix L, Vernimmen D, Jackers P, Winkler R. Yin Yang 1 cooperates with activator protein 2 to stimulate ERBB2 gene expression in mammary cancer cells. J Biol Chem. 2005;280:24428–34. - PubMed
    1. Bosher JM, Totty NF, Hsuan JJ, Williams T, Hurst HC. A family of AP-2 proteins regulates c-erbB-2 expression in mammary carcinoma. Oncogene. 1996;13:1701–7. - PubMed

Publication types

MeSH terms