

Functional expression and intracellular signaling of UTP-sensitive P2Y receptors in theca-interstitial cells
- PMID: 20630102
- PMCID: PMC2912313
- DOI: 10.1186/1477-7827-8-88
Functional expression and intracellular signaling of UTP-sensitive P2Y receptors in theca-interstitial cells
Abstract
Background: Purinergic receptors are expressed in the ovary of different species; their physiological roles remain to be elucidated. UTP-sensitive P2Y receptor activity may regulate cell proliferation. The aim of the present work was to study the functional expression of these receptors in theca/interstitial cells (TIC).
Methods: TIC were isolated by centrifugation in a Percoll gradient. P2Y receptors and cellular markers in TIC were detected by RT-PCR and Western blot. Intracellular calcium mobilization induced by purinergic drugs was evaluated by fluorescence microscopy, phosphorylation of MAPK p44/p42 and of cAMP response element binding protein (CREB) was determined by Western blot and proliferation was quantified by [3H]-thymidine incorporation into DNA.
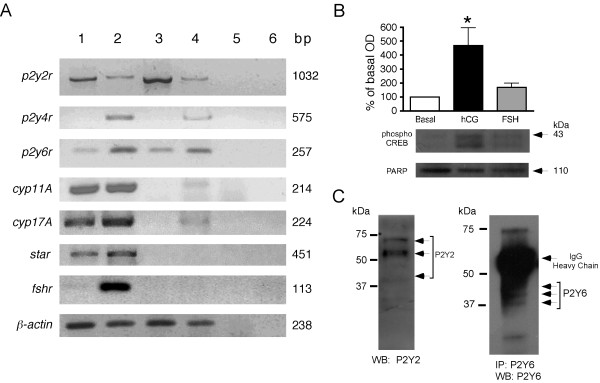
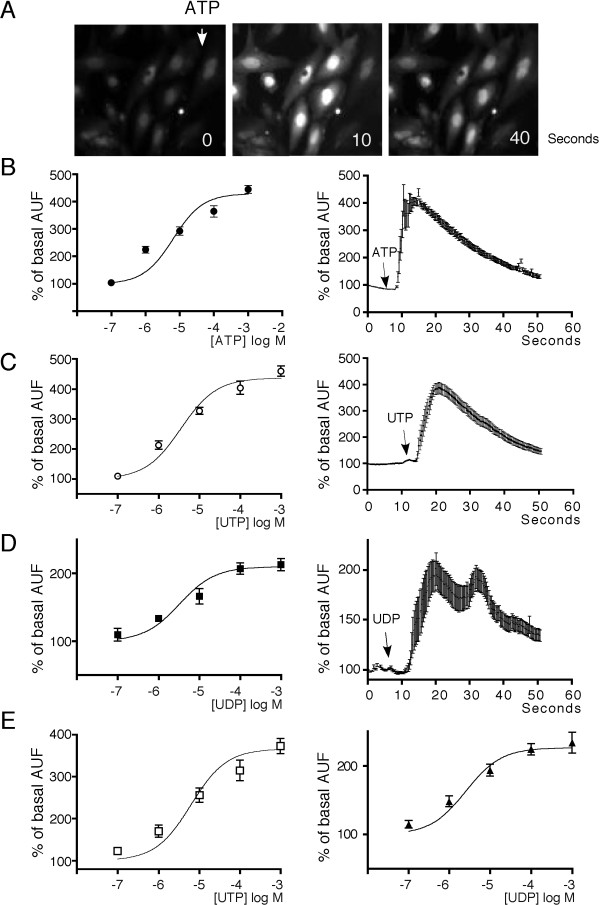
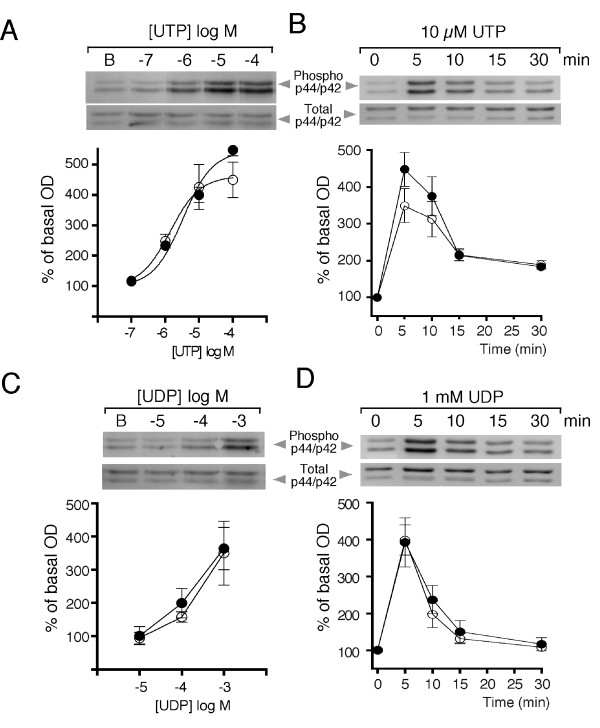
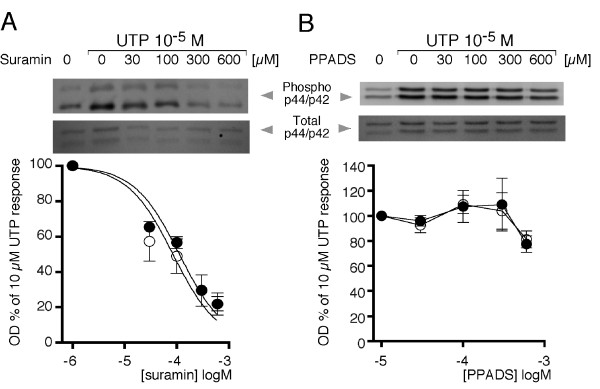
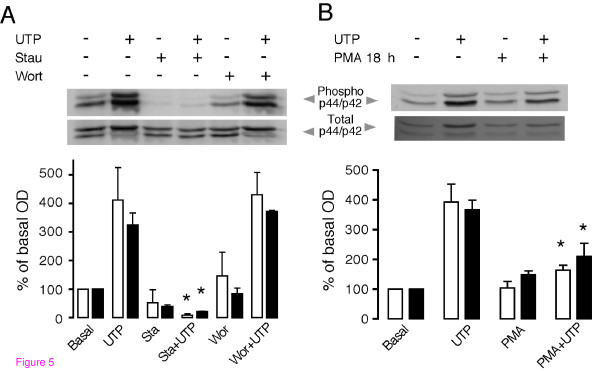
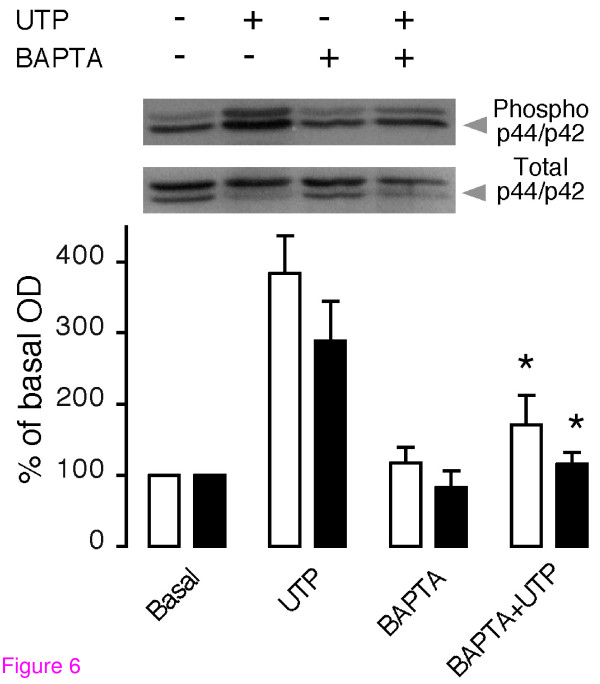
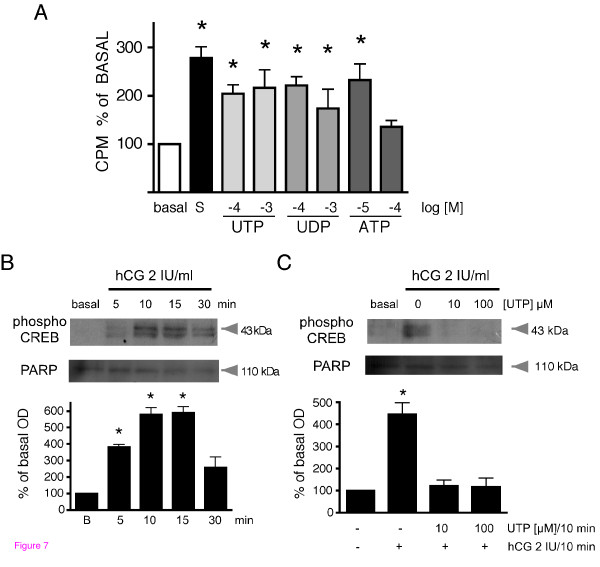
Results: RT-PCR showed expression of p2y2r and p2y6r transcripts, expression of the corresponding proteins was confirmed. UTP and UDP, agonists for P2Y2 and P2Y6 receptors, induced an intracellular calcium increase with a maximum of more than 400% and 200% of basal level, respectively. The response elicited by UTP had an EC50 of 3.5 +/- 1.01 microM, while that for UDP was 3.24 +/- 0.82 microM. To explore components of the pathway activated by these receptors, we evaluated the phosphorylation induced by UTP or UDP of MAPK p44 and p42. It was found that UTP increased MAPK phosphorylation by up to 550% with an EC50 of 3.34 +/- 0.92 and 1.41 +/- 0.67 microM, for p44 and p42, respectively; these increases were blocked by suramin. UDP also induced p44/p42 phosphorylation, but at high concentrations. Phosphorylation of p44/p42 was dependent on PKC and intracellular calcium. To explore possible roles of this pathway in cell physiology, cell proliferation and hCG-induced CREB-phosphorylation assays were performed; results showed that agonists increased cell proliferation and prevented CREB-phosphorylation.
Conclusion: Here, it is shown that UTP-sensitive P2Y receptors are expressed in cultured TIC and that these receptors had the ability to activate mitogenic signaling pathways and to promote cell proliferation, as well as to prevent CREB-phosphorylation by hCG. Regulation of TIC proliferation and steroidogenesis is relevant in ovarian pathophysiology since theca hyperplasia is involved in polycystic ovarian syndrome. Purinergic receptors described might represent an important new set of molecular therapeutic targets.
Figures
Similar articles
-
Evidence for P2Y1, P2Y2, P2Y6 and atypical UTP-sensitive receptors coupled to rises in intracellular calcium in mouse cultured superior cervical ganglion neurons and glia.Br J Pharmacol. 2004 Nov;143(5):525-32. doi: 10.1038/sj.bjp.0705959. Epub 2004 Oct 4. Br J Pharmacol. 2004. PMID: 15466449 Free PMC article.
-
P2Y(2) receptor-mediated proliferation of C(6) glioma cells via activation of Ras/Raf/MEK/MAPK pathway.Br J Pharmacol. 2000 Apr;129(7):1481-9. doi: 10.1038/sj.bjp.0703182. Br J Pharmacol. 2000. PMID: 10742305 Free PMC article.
-
Experimental polycystic ovarian syndrome is associated with reduced expression and function of P2Y2 receptors in rat theca cells.Mol Reprod Dev. 2019 Mar;86(3):308-318. doi: 10.1002/mrd.23106. Epub 2019 Jan 17. Mol Reprod Dev. 2019. PMID: 30624816
-
P2Y2 nucleotide receptor-mediated responses in brain cells.Mol Neurobiol. 2010 Jun;41(2-3):356-66. doi: 10.1007/s12035-010-8115-7. Epub 2010 Apr 13. Mol Neurobiol. 2010. PMID: 20387013 Free PMC article. Review.
-
Regulation of renal NaCl and water transport by the ATP/UTP/P2Y2 receptor system.Am J Physiol Renal Physiol. 2011 Sep;301(3):F463-75. doi: 10.1152/ajprenal.00236.2011. Epub 2011 Jun 29. Am J Physiol Renal Physiol. 2011. PMID: 21715471 Free PMC article. Review.
Cited by
-
Uridine 5'-triphosphate promotes in vitro Schwannoma cell migration through matrix metalloproteinase-2 activation.PLoS One. 2014 Jun 6;9(6):e98998. doi: 10.1371/journal.pone.0098998. eCollection 2014. PLoS One. 2014. PMID: 24905332 Free PMC article.
-
The role of gut microbiota-gonadal axis in ovary activation of Asian honey bee (Apis cerana) queens.NPJ Biofilms Microbiomes. 2025 Jun 7;11(1):97. doi: 10.1038/s41522-025-00723-9. NPJ Biofilms Microbiomes. 2025. PMID: 40483350 Free PMC article.
-
Purinergic signalling in the reproductive system in health and disease.Purinergic Signal. 2014 Mar;10(1):157-87. doi: 10.1007/s11302-013-9399-7. Epub 2013 Nov 23. Purinergic Signal. 2014. PMID: 24271059 Free PMC article. Review.
-
Increased Purinergic Responses Dependent on P2Y2 Receptors in Hepatocytes from CCl4-Treated Fibrotic Mice.Int J Mol Sci. 2020 Mar 26;21(7):2305. doi: 10.3390/ijms21072305. Int J Mol Sci. 2020. PMID: 32225112 Free PMC article.
-
Purinergic signaling pathways in endocrine system.Auton Neurosci. 2015 Sep;191:102-16. doi: 10.1016/j.autneu.2015.04.010. Epub 2015 Apr 25. Auton Neurosci. 2015. PMID: 25960051 Free PMC article. Review.
References
-
- Bjersing L. In: The mammalian ovary. Comparative Biology. Jones RE, editor. New York: Raven Press; 1978. Maturation, morphology and endocrine function of the follicular wall in mammals; pp. 181–214.
-
- Burden HW. In: Catecholamines as hormone regulators. Ben-Jonathan N, Bahr JM, Weener R, editor. New York: Raven Press; 1985. The adrenergic innervation of mammalian ovaries; pp. 261–278.
-
- Owman C, Rosengren E, Sjoberg NO. Adrenergic innervation of the human female reproductive organs: a histochemical and chemical investigation. Obstet Gynecol. 1967;30:763–773. - PubMed
Publication types
MeSH terms
Substances
LinkOut - more resources
Full Text Sources
