

Comprehensive analysis of NAC domain transcription factor gene family in Populus trichocarpa
- PMID: 20630103
- PMCID: PMC3017804
- DOI: 10.1186/1471-2229-10-145
Comprehensive analysis of NAC domain transcription factor gene family in Populus trichocarpa
Abstract
Background: NAC (NAM, ATAF1/2 and CUC2) domain proteins are plant-specific transcriptional factors known to play diverse roles in various plant developmental processes. NAC transcription factors comprise of a large gene family represented by more than 100 members in Arabidopsis, rice and soybean etc. Recently, a preliminary phylogenetic analysis was reported for NAC gene family from 11 plant species. However, no comprehensive study incorporating phylogeny, chromosomal location, gene structure, conserved motifs, and expression profiling analysis has been presented thus far for the model tree species Populus.
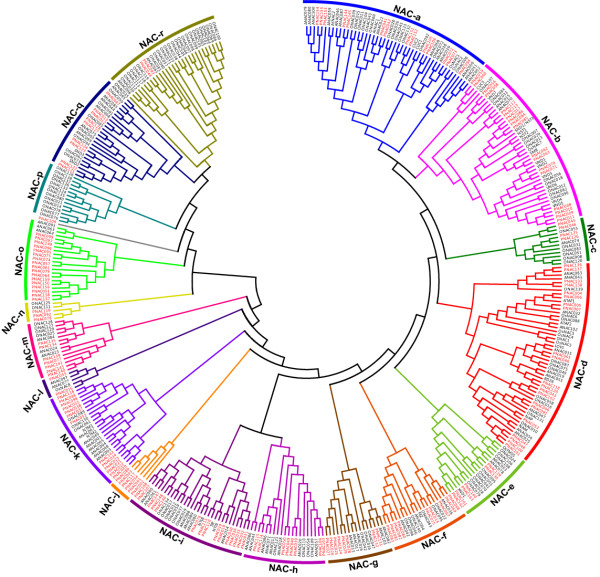
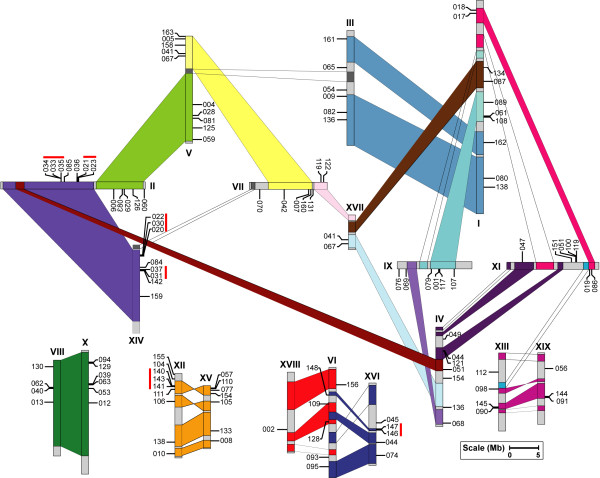
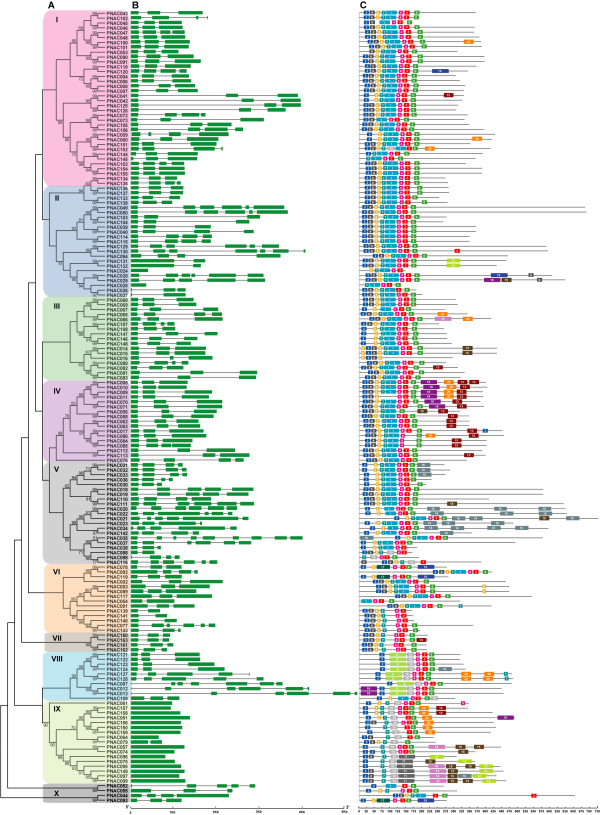
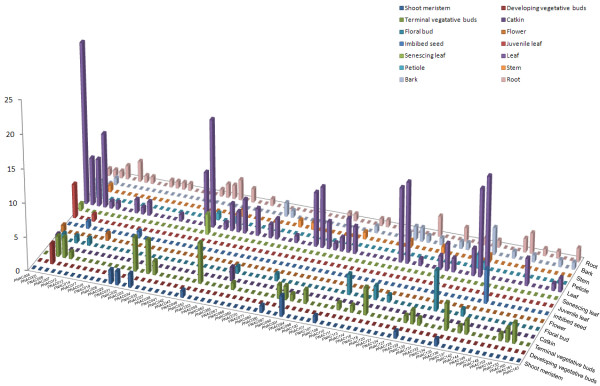
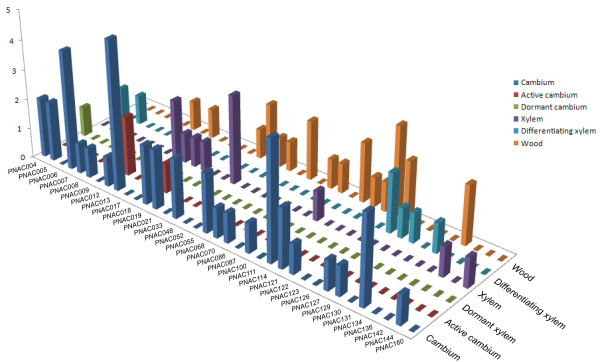
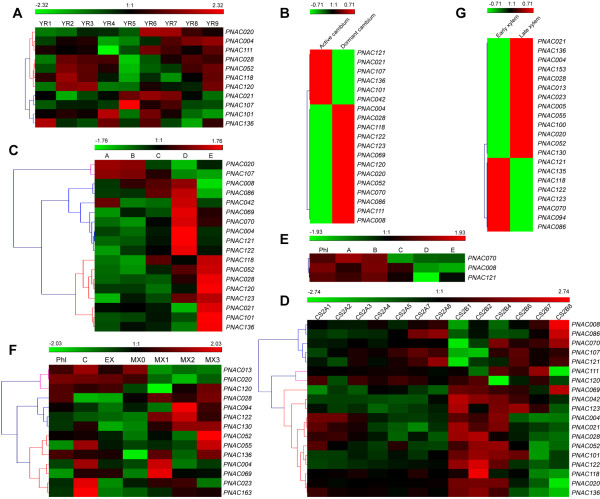
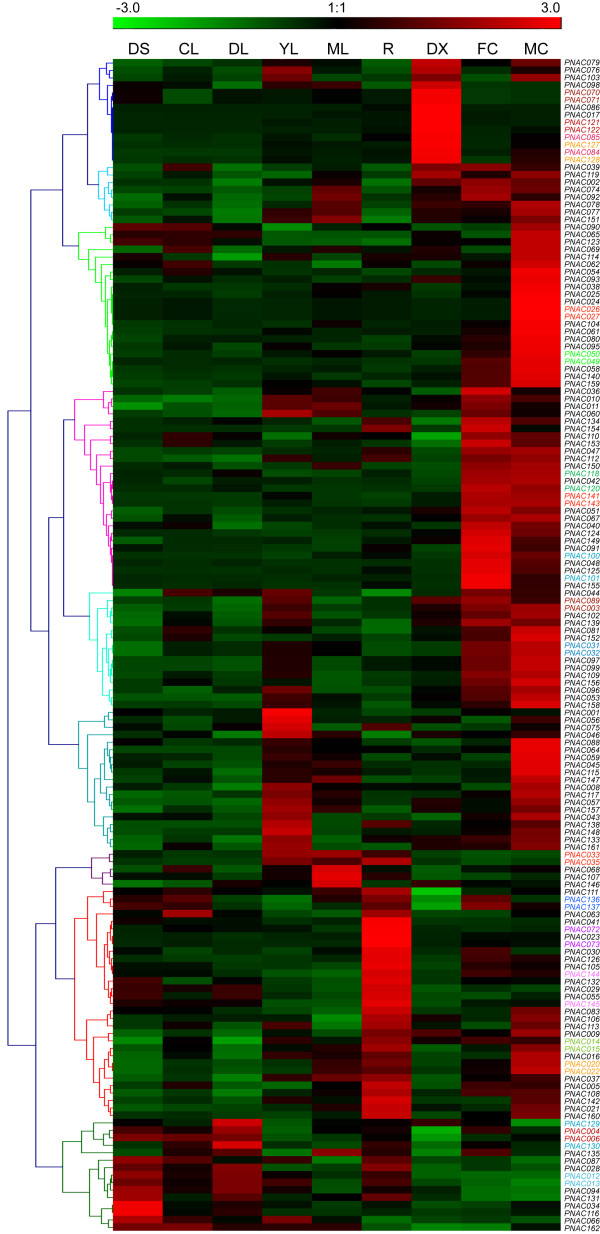
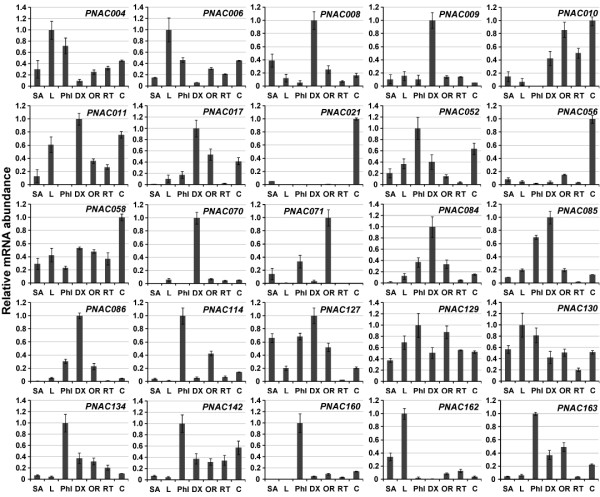
Results: In the present study, a comprehensive analysis of NAC gene family in Populus was performed. A total of 163 full-length NAC genes were identified in Populus, and they were phylogenetically clustered into 18 distinct subfamilies. The gene structure and motif compositions were considerably conserved among the subfamilies. The distributions of 120 Populus NAC genes were non-random across the 19 linkage groups (LGs), and 87 genes (73%) were preferentially retained duplicates that located in both duplicated regions. The majority of NACs showed specific temporal and spatial expression patterns based on EST frequency and microarray data analyses. However, the expression patterns of a majority of duplicate genes were partially redundant, suggesting the occurrence of subfunctionalization during subsequent evolutionary process. Furthermore, quantitative real-time RT-PCR (RT-qPCR) was performed to confirm the tissue-specific expression patterns of 25 NAC genes.
Conclusion: Based on the genomic organizations, we can conclude that segmental duplications contribute significantly to the expansion of Populus NAC gene family. The comprehensive expression profiles analysis provides first insights into the functional divergence among members in NAC gene family. In addition, the high divergence rate of expression patterns after segmental duplications indicates that NAC genes in Populus are likewise to have been retained by substantial subfunctionalization. Taken together, our results presented here would be helpful in laying the foundation for functional characterization of NAC gene family and further gaining an understanding of the structure-function relationship between these family members.
Figures
Similar articles
-
Comprehensive analysis of CCCH zinc finger family in poplar (Populus trichocarpa).BMC Genomics. 2012 Jun 18;13:253. doi: 10.1186/1471-2164-13-253. BMC Genomics. 2012. PMID: 22708723 Free PMC article.
-
Analyses of the NAC transcription factor gene family in Gossypium raimondii Ulbr.: chromosomal location, structure, phylogeny, and expression patterns.J Integr Plant Biol. 2013 Jul;55(7):663-76. doi: 10.1111/jipb.12085. J Integr Plant Biol. 2013. PMID: 23756542
-
Genome-wide identification, evolutionary expansion, and expression profile of homeodomain-leucine zipper gene family in poplar (Populus trichocarpa).PLoS One. 2012;7(2):e31149. doi: 10.1371/journal.pone.0031149. Epub 2012 Feb 16. PLoS One. 2012. PMID: 22359569 Free PMC article.
-
Transcriptional Control of Seed Life: New Insights into the Role of the NAC Family.Int J Mol Sci. 2024 May 14;25(10):5369. doi: 10.3390/ijms25105369. Int J Mol Sci. 2024. PMID: 38791407 Free PMC article. Review.
-
Multiple roles of NAC transcription factors in plant development and stress responses.J Integr Plant Biol. 2025 Mar;67(3):510-538. doi: 10.1111/jipb.13854. Epub 2025 Feb 14. J Integr Plant Biol. 2025. PMID: 39950532 Review.
Cited by
-
Genome-wide identification and expression analysis of the MADS-box gene family during female and male flower development in Juglans mandshurica.Front Plant Sci. 2022 Nov 1;13:1020706. doi: 10.3389/fpls.2022.1020706. eCollection 2022. Front Plant Sci. 2022. PMID: 36388573 Free PMC article.
-
Induced somatic sector analysis of cellulose synthase (CesA) promoter regions in woody stem tissues.Planta. 2013 Mar;237(3):799-812. doi: 10.1007/s00425-012-1792-x. Epub 2012 Nov 7. Planta. 2013. PMID: 23132521
-
Genome-Wide Analysis of C2H2 Zinc-Finger Family Transcription Factors and Their Responses to Abiotic Stresses in Poplar (Populus trichocarpa).PLoS One. 2015 Aug 3;10(8):e0134753. doi: 10.1371/journal.pone.0134753. eCollection 2015. PLoS One. 2015. PMID: 26237514 Free PMC article.
-
Transcriptional regulatory cascade of LcMYB71 and LcNAC73 affects low-temperature and drought stress response in Lonicera caerulea.Front Plant Sci. 2023 Nov 27;14:1288947. doi: 10.3389/fpls.2023.1288947. eCollection 2023. Front Plant Sci. 2023. PMID: 38089802 Free PMC article.
-
Genome-wide analysis of the ABC gene family in almond and functional predictions during flower development, freezing stress, and salt stress.BMC Plant Biol. 2024 Jan 2;24(1):12. doi: 10.1186/s12870-023-04698-7. BMC Plant Biol. 2024. PMID: 38163883 Free PMC article.
References
-
- Riechmann JL, Heard J, Martin G, Reuber L, Jiang C, Keddie J, Adam L, Pineda O, Ratcliffe OJ, Samaha RR, Creelman R, Pilgrim M, Broun P, Zhang JZ, Ghandehari D, Sherman BK, Yu G. Arabidopsis transcription factors: genome-wide comparative analysis among eukaryotes. Science. 2000;290(5499):2105–2110. doi: 10.1126/science.290.5499.2105. - DOI - PubMed
-
- AtTFDB - Arabidopsis transcription factor database. http://arabidopsis.med.ohio-state.edu/AtTFDB/
-
- Tuskan GA, Difazio S, Jansson S, Bohlmann J, Grigoriev I, Hellsten U, Putnam N, Ralph S, Rombauts S, Salamov A, Schein J, Sterck L, Aerts A, Bhalerao RR, Bhalerao RP, Blaudez D, Boerjan W, Brun A, Brunner A, Busov V, Campbell M, Carlson J, Chalot M, Chapman J, Chen GL, Cooper D, Coutinho PM, Couturier J, Covert S, Cronk Q. et al.The genome of black cottonwood, Populus trichocarpa (Torr. & Gray) Science. 2006;313(5793):1596–1604. doi: 10.1126/science.1128691. - DOI - PubMed
Publication types
MeSH terms
Substances
LinkOut - more resources
Full Text Sources
Other Literature Sources
Molecular Biology Databases
Research Materials
