

Validation of reference genes as internal control for studying viral infections in cereals by quantitative real-time RT-PCR
- PMID: 20630112
- PMCID: PMC3095291
- DOI: 10.1186/1471-2229-10-146
Validation of reference genes as internal control for studying viral infections in cereals by quantitative real-time RT-PCR
Abstract
Background: Reference genes are commonly used as the endogenous normalisation measure for the relative quantification of target genes. The appropriate application of quantitative real-time PCR (RT-qPCR), however, requires the use of reference genes whose level of expression is not affected by the test, by general physiological conditions or by inter-individual variability. For this purpose, seven reference genes were investigated in tissues of the most important cereals (wheat, barley and oats). Titre of Barley yellow dwarf virus (BYDV) was determined in oats using relative quantification with different reference genes and absolute quantification, and the results were compared.
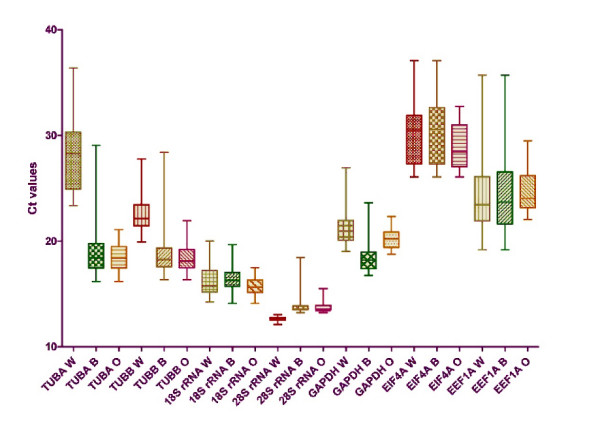
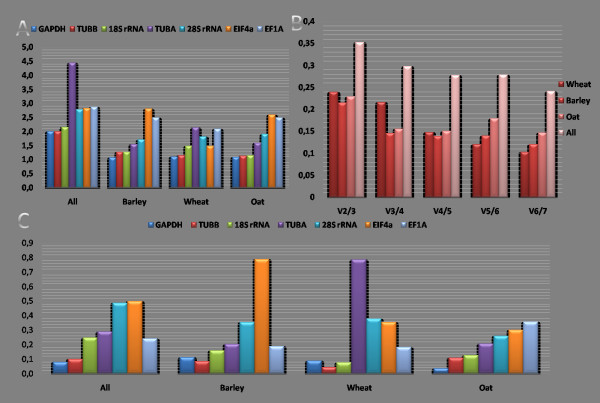
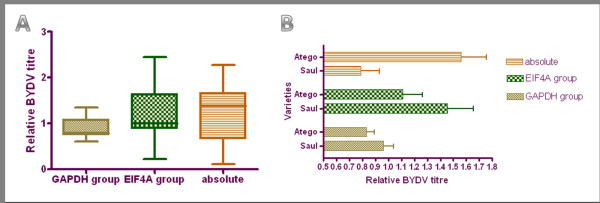
Results: The expression of seven potential reference genes was evaluated in tissues of 180 healthy, physiologically stressed and virus-infected cereal plants. These genes were tested by RT-qPCR and ranked according to the stability of their expression using three different methods (two-way ANOVA, GeNorm and NormFinder tools). In most cases, the expression of all genes did not depend on abiotic stress conditions or virus infections. All the genes showed significant differences in expression among plant species. Glyceraldehyde-3-phosphate dehydrogenase (GAPDH), beta-tubulin (TUBB) and 18S ribosomal RNA (18S rRNA) always ranked as the three most stable genes. On the other hand, elongation factor-1 alpha (EF1A), eukaryotic initiation factor 4a (EIF4A), and 28S ribosomal RNA (28S rRNA) for barley and oat samples; and alpha-tubulin (TUBA) for wheat samples were consistently ranked as the less reliable controls.The BYDV titre was determined in two oat varieties by RT-qPCR using three different quantification approaches. There were no significant differences between the absolute and relative quantifications, or between quantification using GAPDH + TUBB + TUBA +18S rRNA and EF1A + EIF4A + 28S rRNA. However, there were discrepancies between the results of individual assays.
Conclusions: The geometric average of GAPDH, 18S rRNA and TUBB is suitable for normalisation of BYDV quantification in barley tissues. For wheat and oat samples, a combination of four genes is necessary: GAPDH, 18S rRNA, TUBB and EIF4A for wheat; and GAPDH, 18S rRNA, TUBB and TUBA for oat is recommended.
Figures
References
-
- Rastgou M, Khatabi B, Kvarnheden A, Izadpanah K. Relationships of Barley yellow dwarf virus-PAV and Cereal yellow dwarf virus-RPV from Iran with viruses of the family Luteoviridae. Eur J Plant Pathology. 2005;113:321–326. doi: 10.1007/s10658-005-1231-y. 4. - DOI
-
- D'Arcy CJ. In: Barley yellow dwarf: 40 years of progress. D'Arcy CJ, Burnett PA, editor. APS Press, St. Paul MN; 2005. Symptomatology and host range of barley yellow dwarf; pp. 9–28.
-
- Cooper JI, Jones AT. Responses of plants to viruses: proposals for the use of terms. Phytopathology. 1983;73(2):127–128. doi: 10.1094/Phyto-73-127. - DOI
-
- Osmond CB. Photorespiration and photoinhibition: some implications for the energetics of photosynthesis. Biochim Biophys Acta. 1981;639:77–98.
-
- Kassanis B. Effects of changing temperature on virus diseases. Adv Virus Res. 2003;IV:221–241. - PubMed
Publication types
MeSH terms
Substances
LinkOut - more resources
Full Text Sources
Other Literature Sources
Research Materials
Miscellaneous
