. 2010 Sep 24;285(39):29750-9.
doi: 10.1074/jbc.M110.119388. Epub 2010 Jul 14.

Posttranslational modification of the NH2-terminal region of CXCL5 by proteases or peptidylarginine Deiminases (PAD) differently affects its biological activity

Affiliations

Posttranslational modification of the NH2-terminal region of CXCL5 by proteases or peptidylarginine Deiminases (PAD) differently affects its biological activity

Anneleen Mortier et al. J Biol Chem. .

Abstract

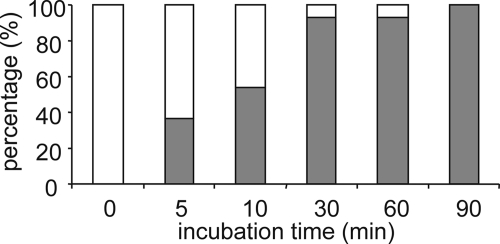
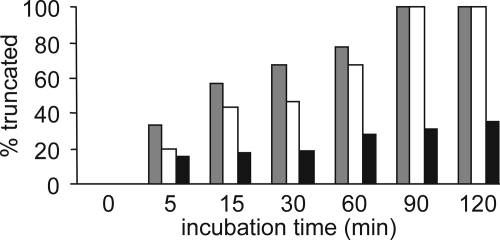
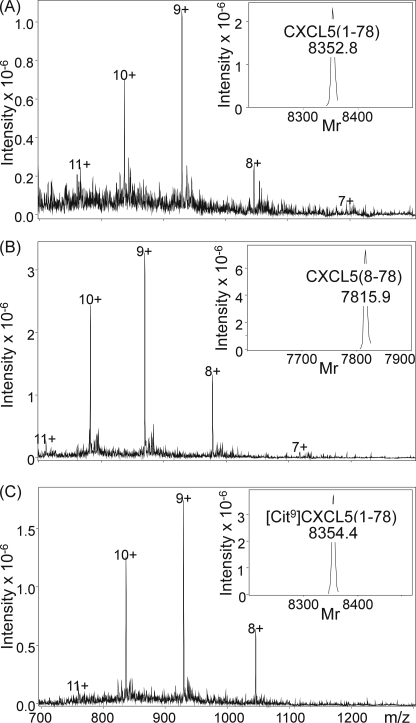
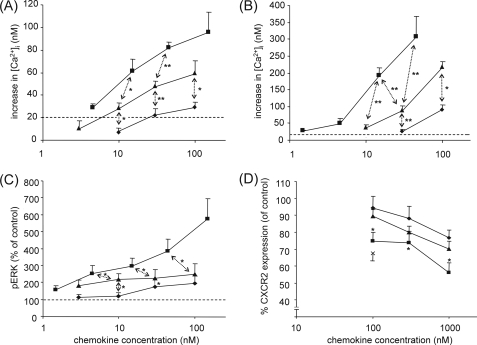
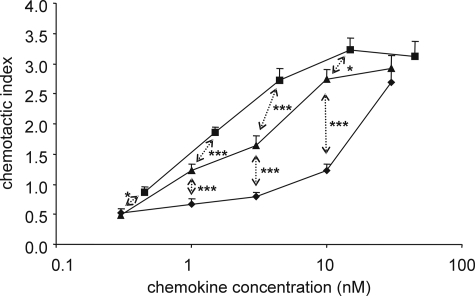
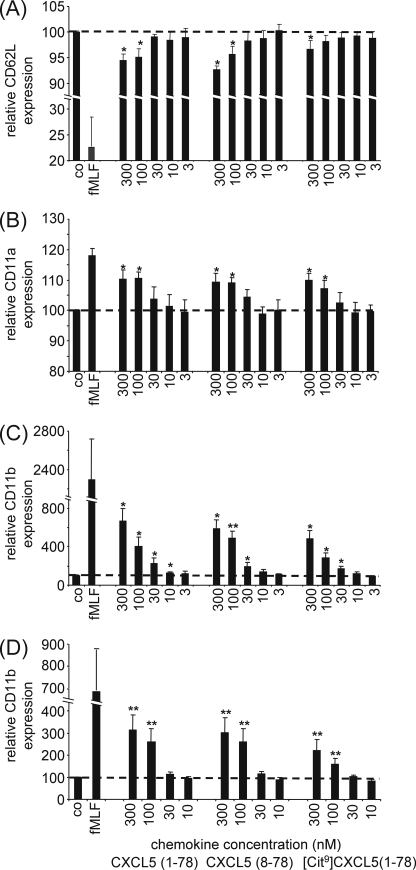
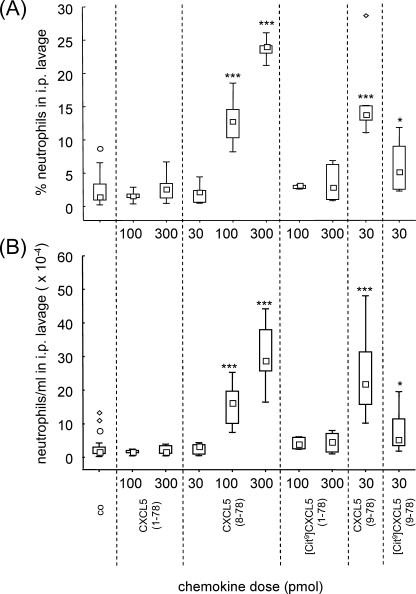
Posttranslational modifications, e.g. proteolysis, glycosylation, and citrullination regulate chemokine function, affecting leukocyte migration during inflammatory responses. Here, modification of CXCL5/epithelial cell-derived neutrophil-activating protein-78 (ENA-78) by proteases or peptidylarginine deiminases (PAD) was evaluated. Slow CXCL5(1-78) processing by the myeloid cell marker aminopeptidase N/CD13 into CXCL5(2-78) hardly affected its in vitro activity, but slowed down the activation of CXCL5 by the neutrophil protease cathepsin G. PAD, an enzyme with a potentially important function in autoimmune diseases, site-specifically deiminated Arg(9) in CXCL5 to citrulline, generating [Cit(9)]CXCL5(1-78). Compared with CXCL5(1-78), [Cit(9)]CXCL5(1-78) less efficiently induced intracellular calcium signaling, phosphorylation of extracellular signal-regulated kinase, internalization of CXCR2, and in vitro neutrophil chemotaxis. In contrast, conversion of CXCL5 into the previously reported natural isoform CXCL5(8-78) provided at least 3-fold enhanced biological activity in these tests. Citrullination, but not NH(2)-terminal truncation, reduced the capacity of CXCL5 to up-regulate the expression of the integrin α-chain CD11b on neutrophils. Truncation nor citrullination significantly affected the ability of CXCL5 to up-regulate CD11a expression or shedding of CD62L. In line with the in vitro results, CXCL5(8-78) and CXCL5(9-78) induced a more pronounced neutrophil influx in vivo compared with CXCL5(1-78). Administration of 300 pmol of either CXCL5(1-78) or [Cit(9)]CXCL5(1-78) failed to attract neutrophils to the peritoneal cavity. Citrullination of the more potent CXCL5(9-78) lowers its chemotactic potency in vivo and confirms the tempering effect of citrullination in vitro. The highly divergent effects of modifications of CXCL5 on neutrophil influx underline the potential importance of tissue-specific interactions between chemokines and PAD or proteases.


Figures

FIGURE 1.
FIGURE 1.
Citrullination of CXCL5 by PAD. Recombinant CXCL5(1–78) was incubated with rabbit PAD2 at an E/S molar ratio of 1/20. At several time points the reaction was stopped with TFA, and the reaction mixture was analyzed by ion trap mass spectrometry combined with Edman degradation-based NH2-terminal sequencing to define the conversion rate. The defined percentages of CXCL5(1–78) (open bar) and [Cit9]CXCL5(1–78) (filled bar) are shown at the indicated time points.
FIGURE 2.
FIGURE 2.
Effect of citrullination and cleavage by CD13 on the susceptibility of CXCL5 to NH2-terminal cleavage by cathepsin G. CXCL5(1–78) is a substrate for the serine protease cathepsin G, generating the more potent CXCL5(9–78) (47). Percentages of generated CXCL5(9–78) in function of time are depicted for CXCL5(1–78) (open bar), [Cit9]CXCL5(1–78) (grey bar), and CXCL5(2–78) (black bar).
FIGURE 3.
FIGURE 3.
Chemical synthesis of CXCL5 and modified isoforms. Synthesized CXCL5 isoforms were purified by RP-HPLC combined with on-line mass spectrometry. Fractions containing homogenous, folded CXCL5 were pooled, lyophilized, and dissolved in ultrapure water. Finally, the quality of the synthetic CXCL5(1–78), CXCL5(8–78), or [Cit9]CXCL5(1–78) was confirmed by mass spectrometry analysis, as depicted in panels A–C, respectively. The raw mass spectra were averaged over the chromatographic peaks and show the multiply charged ions. Based on these ions, Bruker deconvolution software allowed for calculation of the Mr of the uncharged molecule, which is shown as an inset and corresponds to the theoretical Mr.
FIGURE 4.
FIGURE 4.
Signaling capacity of CXCL5 isoforms through CXCR2. CXCR2-transfected HEK293 cells (panel A) and granulocytes (panel B) were loaded with the ratiometric Ca2+-binding molecule Fura-2, and [Ca2+]i was measured upon stimulation of the cells with the indicated concentrations of CXCL5(1–78) (▴), CXCL5(8–78) (■), or [Cit9]CXCL5(1–78) (♦). Values represent the mean (±S.E.) increase of the [Ca2+]i (n ≥ 3). The dashed line indicates the detection limit (20 nm). Significant differences between CXCL5(1–78) and other CXCL5 isoforms were detected using the Mann-Whitney U test (*, p < 0.05; **, p < 0.01). The amount of phosphorylated ERK1/2 in CXCR2-transfected HEK293 cells after 5 min of stimulation with the indicated concentrations of CXCL5(1–78) (▴), CXCL5(8–78) (■), and [Cit9]CXCL5(1–78) (♦) is depicted in panel C. The values shown are the percentages of ERK1/2 phosphorylation compared with medium-treated control cells (± S.E.) (n = 6). For comparison with the corresponding concentrations of intact CXCL5(1–78), the Wilcoxon matched-pairs signed ranks test was used (*, p < 0.05). Internalization of CXCR2 was tested on CXCR2-transfected HEK293 cells. Panel D shows the relative CXCR2 surface expression (compared with medium-treated control cells) following stimulation with the indicated concentrations of CXCL5(1–78) (▴), CXCL5(8–78) (■), and [Cit9]CXCL5(1–78) (♦) (n ≥ 6). 100 nm IL-8(1–77) (×) was enclosed as a positive control. Statistical comparison of the CXCL5 isoforms was done by use of the Wilcoxon matched-pairs signed ranks test (*, p < 0.05), and error bars indicate the standard error of the mean (S.E.).
FIGURE 5.
FIGURE 5.
In vitro chemotactic activity of CXCL5 isoforms for neutrophils. The Multiscreen chemotaxis assay was used to evaluate the chemotactic activity of CXCL5(1–78) (▴), CXCL5(8–78) (■), and [Cit9]CXCL5(1–78) (♦) in vitro (3 independent experiments). The chemotactic index is calculated by dividing the luminescence intensity of the test sample by the luminescence intensity of the control buffer. Statistical analysis of the CXCL5 isoforms with regard to each other and to the control buffer was performed using the Mann-Whitney U test (*, p < 0.05; ***, p < 0.001 for significant differences between CXCL5(1–78) and the other CXCL5 isoforms). Error bars indicate the S.E.
FIGURE 6.
FIGURE 6.
Regulation of the expression pattern of adhesion molecules on neutrophils by CXCL5 isoforms. Freshly isolated leukocytes were stimulated with the indicated concentrations of CXCL5 isoforms, 10−7 m fMLF as a positive control or vehicle (PBS) as a negative control (co) for 10 (panels A–C) or 2 min (panel D) at 37 °C. The expression patterns of L-selectin (CD62L) (panel A), CD11a (panel B), and CD11b (panels C and D) were evaluated by staining the stimulated cells with the appropriate antibodies, followed by FACS analysis. The mean fluorescence intensity upon stimulation with CXCL5 was divided by the mean fluorescence intensity upon PBS treatment and multiplied by 100 to obtain the relative expression of CD62L, CD11a, or CD11b. Values represent the mean relative expression (formulated as percentages) (± S.E.) of 5 independent experiments (5 different donors). The Wilcoxon single-sample signed ranks test was performed to statistically compare the relative adhesion molecule expression to buffer control (*, p < 0.05; **, p < 0.01).
FIGURE 7.
FIGURE 7.
In vivo chemotactic activity of CXCL5 isoforms for neutrophils. In vivo neutrophil chemotaxis in mice in response to intraperitoneal injection of CXCL5(1–78), CXCL5(8–78), [Cit9]CXCL5(1–78), CXCL5(9–78), and [Cit9]CXCL5(9–78) was investigated. The total amount of leukocytes/ml in the intraperitoneal lavage was counted in Türk solution and the proportional amount of neutrophils in the peritoneal cavity was determined by differential counting of Hemacolor-stained cytospins. Panel A, the neutrophil percentages in the intraperitoneal lavage upon stimulation with buffer or CXCL5 are shown. Panel B, total neutrophil counts/ml are calculated and depicted in function of the CXCL5 isoform and concentration. Squares indicate the median neutrophil influx (formulated as percentages or total counts/ml); the bottom and the top of the rectangle denote the 25th and 75th percentile; whiskers represent the non-outlier range (coefficient 1.5) (CXCL5-treated mice: n = 3 to 9; control mice: n = 17). Outliers (○) and extremes (♢) are also plotted. Control mice (co), treated with vehicle, were included to quantify the spontaneous migration of neutrophils to the intraperitoneal cavity. The Mann-Whitney U test was used for statistical analysis (*, p < 0.05; ***, p < 0.001; compared with injection with vehicle).

References

    1. Kennedy A. D., DeLeo F. R. (2009) Immunol. Res. 43, 25–61 - PubMed
    1. Nauseef W. M. (2007) Immunol. Rev. 219, 88–102 - PubMed
    1. Nathan C. (2006) Nat. Rev. Immunol. 6, 173–182 - PubMed
    1. Eyles J. L., Roberts A. W., Metcalf D., Wicks I. P. (2006) Nat. Clin. Pract. Rheumatol. 2, 500–510 - PubMed
    1. Pham C. T. (2008) Int. J. Biochem. Cell Biol. 40, 1317–1333 - PMC - PubMed

Publication types

MeSH terms