. 2010 Aug 1;70(15):6313-24.
doi: 10.1158/0008-5472.CAN-10-0999. Epub 2010 Jul 14.

Vorinostat and sorafenib increase CD95 activation in gastrointestinal tumor cells through a Ca(2+)-de novo ceramide-PP2A-reactive oxygen species-dependent signaling pathway

Affiliations

Vorinostat and sorafenib increase CD95 activation in gastrointestinal tumor cells through a Ca(2+)-de novo ceramide-PP2A-reactive oxygen species-dependent signaling pathway

Margaret A Park et al. Cancer Res. .

Abstract

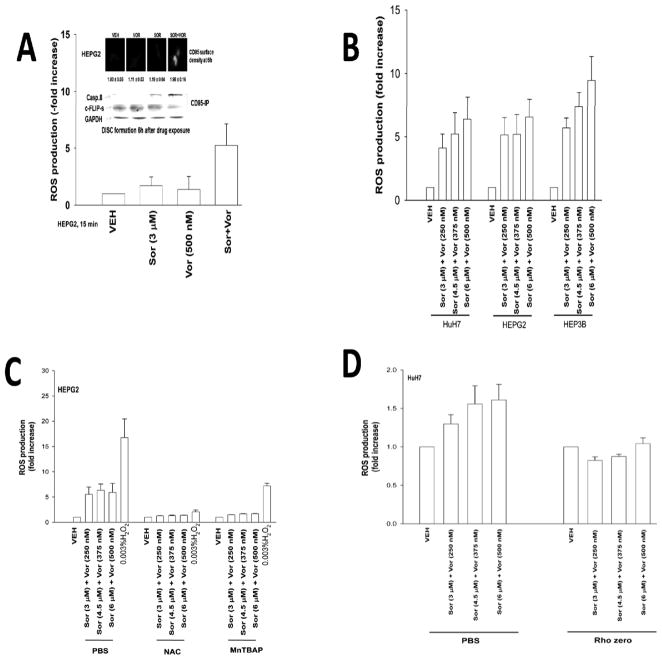
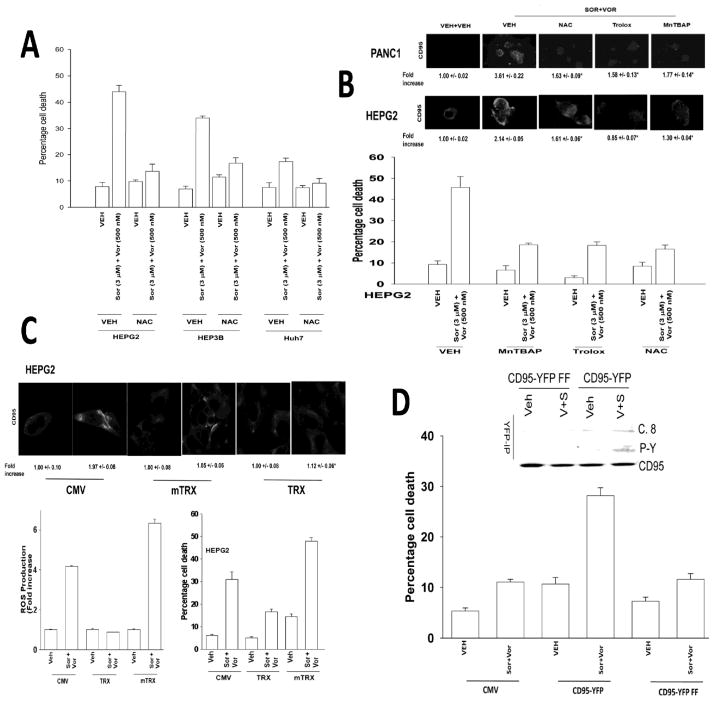
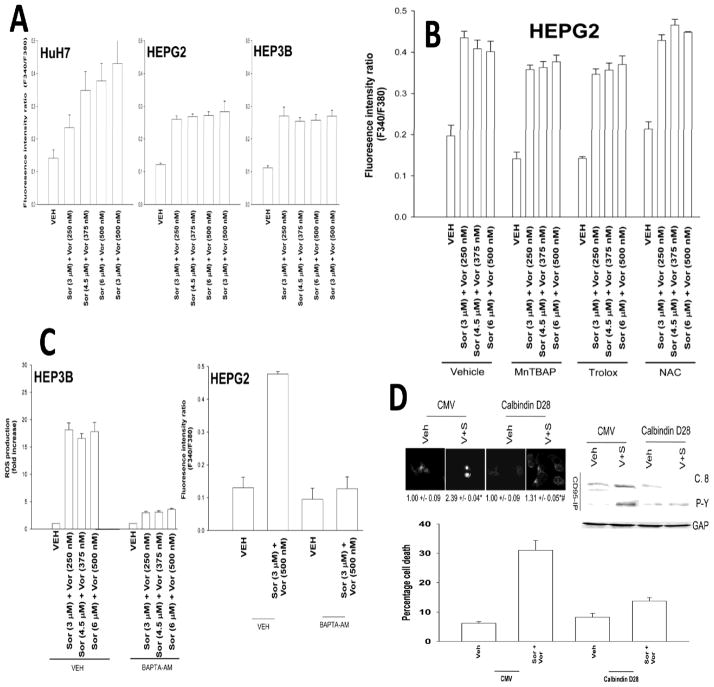
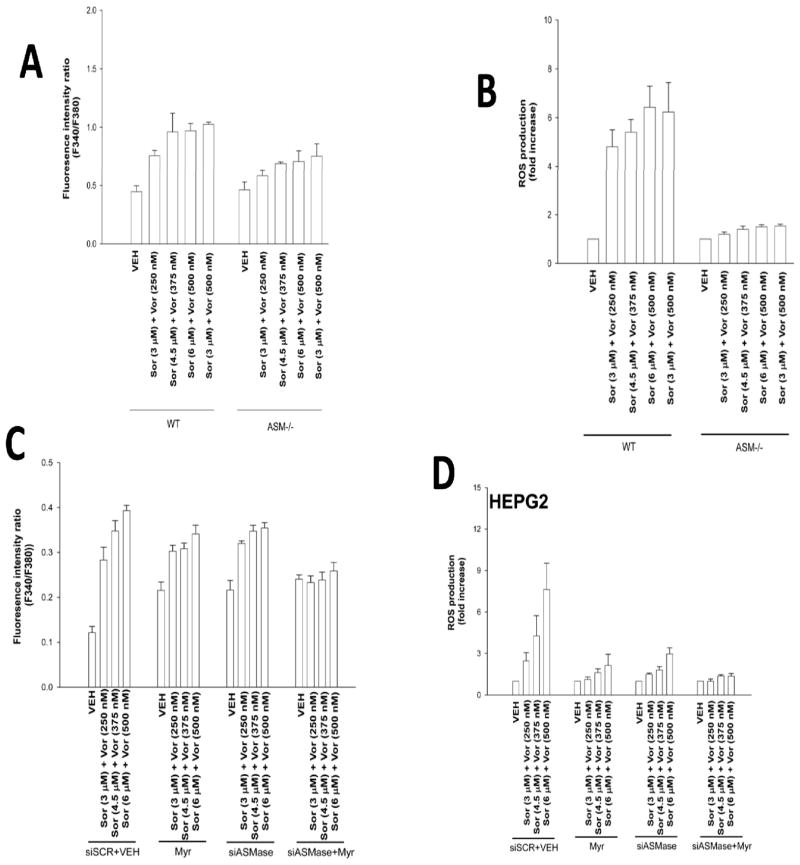
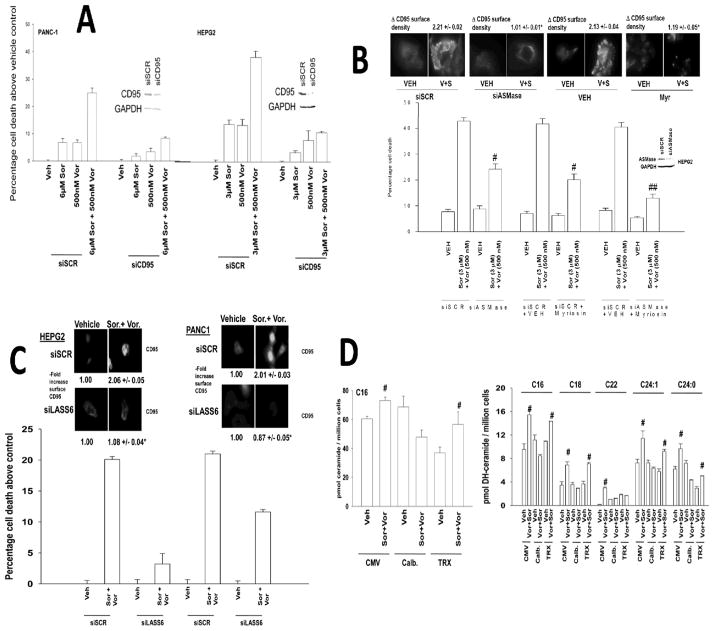
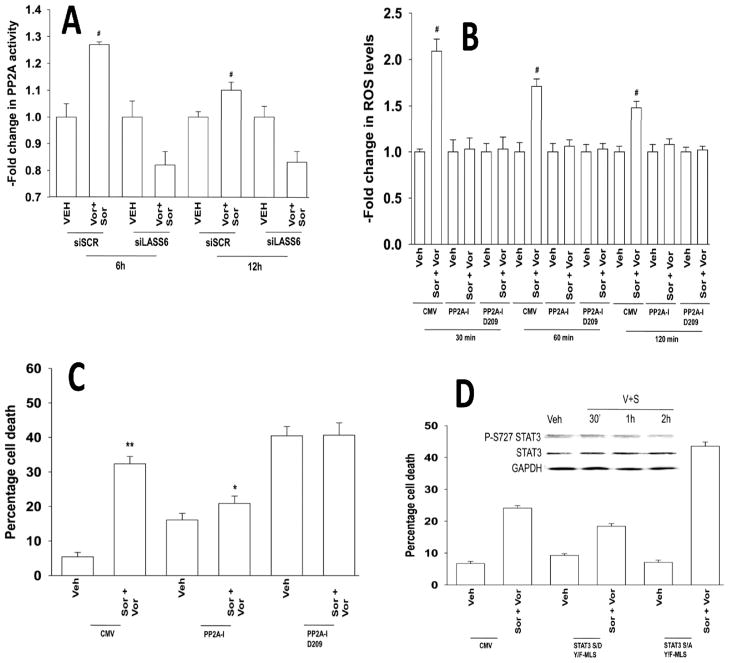
The targeted therapeutics sorafenib and vorinostat interact in a synergistic fashion to kill carcinoma cells by activating CD95, and this drug combination is entering phase I evaluation. In this study, we determined how CD95 is activated by treatment with this drug combination. Low doses of sorafenib and vorinostat, but not the individual drugs, rapidly increased reactive oxygen species (ROS), Ca(2+), and ceramide levels in gastrointestinal tumor cells. The production of ROS was reduced in Rho zero cells. Quenching ROS blocked drug-induced CD95 surface localization and apoptosis. ROS generation, CD95 activation, and cell killing was also blocked by quenching of induced Ca(2+) levels or by inhibition of PP2A. Inhibition of acidic sphingomyelinase or de novo ceramide generation blocked the induction of ROS; however, combined inhibition of both acidic sphingomyelinase and de novo ceramide generation was required to block the induction of Ca(2+). Quenching of ROS did not affect drug-induced ceramide/dihydro-ceramide levels, whereas quenching of Ca(2+) reduced the ceramide increase. Sorafenib and vorinostat treatment radiosensitized liver and pancreatic cancer cells, an effect that was suppressed by quenching ROS or knockdown of LASS6. Further, sorafenib and vorinostat treatment suppressed the growth of pancreatic tumors in vivo. Our findings show that induction of cytosolic Ca(2+) by sorafenib and vorinostat is a primary event that elevates dihydroceramide levels, each essential steps in ROS generation that promotes CD95 activation.


Figures

Figure 1
Figure 1. Sorafenib and vorinostat interact to increase ROS levels in GI tumor cells
Panel A. HEPG2 cells were treated with vehicle (DMSO), sorafenib (Sor), vorinostat (Vor) or in combination. ROS levels were measured 15 min after exposure and plotted as the –Fold increase (n = 2, +/− SEM). Upper: HEPG2 cells were treated with sorafenib, vorinostat or the combination and 6h after exposure cells were fixed and CD95 surface levels determined by IHC; HEPG2 cells were treated with vehicle (DMSO), sorafenib, vorinostat or the combination and 6h after exposure cells were lysed and CD95 immunoprecipitated followed by immunoblotting of the precipitate for DISC formation. Panel B. Cells were treated with vehicle (DMSO), sorafenib and vorinostat. ROS levels were measured 15 min after exposure and plotted as the –Fold increase (n = 2, +/− SEM). Panel C. HEPG2 cells were treated with vehicle (PBS), N-acetyl cysteine or MnTBAP followed 30 min later by sorafenib and vorinostat. ROS levels were measured 15 min after exposure and plotted as the –Fold increase (n = 2, +/− SEM). Panel D. HuH7 parental and rho zero hepatoma cells were treated with vehicle (DMSO), sorafenib and vorinostat. ROS levels were measured 15 min after exposure and plotted as the –Fold increase (n = 2, +/− SEM).
Figure 2
Figure 2. ROS play a central role in CD95 activation and apoptosis
Panel A. Hepatoma cells were pre-treated with N-acetyl cysteine and then with sorafenib and vorinostat. Viability was determined by trypan blue after 48h (n = 3, +/− SEM). Panel B. Lower Panel: HEPG2 cells were pre-treated with N-acetyl cysteine, Trolox or MnTBAP and with sorafenib and vorinostat. ROS levels were measured 15 min after exposure (n = 2, +/− SEM). Upper IHC: PANC1 and HEPG2 cells were pre-treated with N-acetyl cysteine, Trolox or MnTBAP and 30 min later treated with sorafenib and vorinostat. Cells were fixed after 6h and cell surface CD95 levels determined. Panel C. Lower graphs: Left: HEPG2 cells were transfected with empty vector (CMV) or to express either wild type Thioredoxin (TRX) or mutant inactive Thioredoxin (mTRX). Twenty-four h after transfection cells were treated with sorafenib (3.0 μM) and vorinostat (500 nM). ROS levels were measured 15 min after treatment (n = 2, +/− SEM); Right: HEPG2 cells were transfected to express either TRX or mTRX. Twenty-four h after transfection cells were treated with, sorafenib, vorinostat or both drugs. Cells were isolated after 48h and viability determined by trypan blue (n = 3, +/− SEM). Upper IHC: HEPG2 cells were transfected to express TRX or mTRX. Twenty-four h after transfection cells were treated with sorafenib and vorinostat. Six h after treatment cells were fixed and CD95 plasma membrane levels determined (n = 2, +/− SEM). Panel D. Lower Graph: HuH7 cells were transfected to express CD95-YFP or CD95-YFP FF. Twenty-four h after transfection cells were treated with sorafenib (3.0 μM) and vorinostat (500 nM). Cells were isolated after 48h and viability determined by trypan blue (n = 2, +/− SEM). Upper section: HuH7 cells were transfected to express CD95-YFP or CD95-YFP FF. Twenty-four h after transfection cells were treated with sorafenib and vorinostat. Cells were isolated after 6h and CD95 immunoprecipitated to determine DISC formation and CD95 tyrosine phosphorylation.
Figure 3
Figure 3. Sorafenib and vorinostat treatment modulates Ca2+ signaling
Panel A. Hepatoma cells were treated with sorafenib and vorinostat. Cytosolic Ca2+ levels were measured 15 min after exposure and plotted as the fluorescence intensity ratio (n = 2, +/− SEM). Panel B. HEPG2 cells were pre-treated with MnTBAP, N-acetyl cysteine or Trolox followed 30 min later by treatment with sorafenib and vorinostat. Cytosolic Ca2+ levels were measured 15 min after exposure (n = 2, +/− SEM). Panel C. left section: HEP3B cells were pre-incubated in Ca2+ free media for 1h prior to addition of BAPTA-AM or vehicle. Ten minutes after BAPTA-AM addition were treated with sorafenib and vorinostat or with CaCl2. ROS levels were measured 15 min after exposure (n = 2, +/− SEM). Right section: HEPG2 cells were pre-incubated in Ca2+ free media for 1h prior to addition of BAPTA-AM or vehicle. Ten minutes after BAPTA-AM addition were treated with sorafenib and vorinostat. Cytosolic Ca2+ levels were measured 15 min after exposure (n = 2, +/− SEM). Panel D. Upper CD95 IHC: HEPG2 cells were transfected to express Calbindin D28 and 24h later were treated with sorafenib (3 μM) and vorinostat (500 nM). Six h after exposure cells were fixed and the levels of plasma membrane CD95 determined (n = 2, +/− SEM). Blotting: HEPG2 cells were transfected to express Calbindin D28 and 24h later were treated with sorafenib and vorinostat. Six h after exposure cells were isolated and CD95 immunoprecipitated and DISC formation determined (n = 3). Lower graph: HEPG2 cells were transfected to express Calbindin D28 and 24h later were treated with sorafenib and vorinostat. Cells were isolated 48h later and viability determined by trypan blue (n = 2, +/− SEM).
Figure 4
Figure 4. ROS generation is ceramide dependent
Panel A. Primary mouse hepatocytes (wild type and acidic sphingomyelinase null) were treated with sorafenib and vorinostat. Cytosolic Ca2+ levels were measured 15 min after exposure (n = 2, +/− SEM). Panel B. Primary mouse hepatocytes were treated with sorafenib and vorinostat. ROS levels were measured 15 min after drug exposure (n = 2, +/− SEM). Panel C. HEPG2 cells were transfected with an siRNA to knock down ASMase. Twenty-four h later cells were treated with myriocin, and were then treated with sorafenib and vorinostat. Cytosolic Ca2+ levels were measured 15 min after drug exposure (n = 2, +/− SEM). Panel D. HEPG2 cells were transfected with an siRNA to knock down ASMase. Twenty-four h later cells were treated with myriocin as indicated, and were then treated with sorafenib and vorinostat. ROS levels were measured 15 min after drug exposure (n = 2, +/− SEM).
Figure 5
Figure 5. Co-dependent ceramide and Ca2+ regulation of CD95 activity and GI tumor cell killing
Panel A. HEPG2 and PANC-1 cells were transfected to knock down expression of CD95. Cells were treated 24h after transfection with sorafenib, vorinostat or both drugs. Viability was determined by trypan blue after 48h (n = 3, +/− SEM). Panel B. HEPG2 cells were transfected to knock down the expression ASMase. Cells were treated 24h after transfection with myriocin and 30 min later with sorafenib and vorinostat. Upper IHC, Cells were transfected as indicated and 24h later treated with drugs. Cells, after 6h cells were fixed and CD95 plasma membrane levels determined (n = 3, +/− SEM). Lower graph: 48h after exposure, viability was determined by trypan blue (n = 3, +/− SEM). Panel C. HEPG2 and PANC-1 cells were transfected to knock down expression of LASS6. Cells were treated 24h after transfection with sorafenib and vorinostat. Upper IHC, 6h after exposure cells were fixed and the levels of plasma membrane CD95 determined (n = 3, +/− SEM). Lower graph: 48h after drug exposure, viability was determined by trypan blue (n = 3, +/− SEM). Panel D. HEPG2 cells were transfected with plasmids to express Calbindin D28 or TRX. Twenty-four h after transfection cells were treated with sorafenib and vorinostat. Six h after treatment cells were taken and lysed and processed to isolate the lipid fraction of the cell. The levels of C16 ceramide and C16-C24:0 dihydroceramide were determined using a tandem mass spectrometer as described in the Methods section (n = 2, +/− SEM) #p < 0.05 greater than corresponding vehicle treated value.
Figure 6
Figure 6. Sorafenib and vorinostat treatment activates PP2A in a LASS6-dependent fashion: PP2A activation is essential for enhanced ROS levels
Panel A. HEPG2 cells were transfected to knock down LASS6 expression (siLASS6). Twenty four h after transfection cells were treated with sorafenib and vorinostat. Cells were processed for PP2A activity according to the manufacturer’s instructions. Data are the Fold change in PP2A activity (n = 2, +/− SEM) # p < 0.05 greater than corresponding vehicle treated value. Panel B. HEPG2 cells were transfected with plasmids to express wild type or mutant D209 PP2A-Inhibitor proteins. ROS levels were measured 15 min after drug exposure (n = 2, +/− SEM). Panel C. HEPG2 cells were transfected with plasmids to express wild type or mutant D209 PP2A-Inhibitor proteins. Twenty four h after transfection cells were treated with sorafenib and vorinostat. Cells were isolated and viability determined by trypan blue after 48h (n = 3, +/− SEM). Panel D. HEPG2 cells were transfected with plasmids to express mitochondria localized STAT3 S727A or STAT3 S727D. Twenty four h after transfection cells were treated with sorafenib and vorinostat. Viability was determined by trypan blue after 48h (n = 3, +/− SEM). Upper Inset: HEPG2 cells were treated with sorafenib and vorinostat and cells isolated at the indicated times and the levels of STAT3 S727, total STAT3 and GAPDH (n = 3).

References

    1. Parkin DM, Bray F, Ferlay J, Pisani P. Global cancer statistics, 2002. CA Cancer J Clin. 2005;55:74–108. - PubMed
    1. Bilimoria KY, Bentrem DJ, Lillemoe KD, Talamonti MS, Ko CY Pancreatic Cancer Quality Indicator Development Expert Panel, American College of Surgeons. Assessment of pancreatic cancer care in the United States based on formally developed quality indicators. J Natl Cancer Inst. 2009;101:848–59. - PMC - PubMed
    1. Dent P. MAP kinase pathways in the control of hepatocyte growth, metabolism and survival. In: Dufour JF, Clavien P-A, editors. Signaling Pathways in Liver Diseases. Chapter 19. Springer Press; 2005. pp. 223–238.
    1. Dent P, Yacoub A, Fisher PB, Hagan MP, Grant S. MAPK pathways in radiation responses. Oncogene. 2003;22:5885–96. - PubMed
    1. Valerie K, Yacoub A, Hagan MP, et al. Radiation-induced cell signaling: inside-out and outside-in. Mol Cancer Ther. 2007;6:789–801. - PubMed

Publication types

MeSH terms