. 2010 Jul 14;30(28):9477-87.
doi: 10.1523/JNEUROSCI.0333-10.2010.

Functional connectivity and brain networks in schizophrenia

Affiliations

Functional connectivity and brain networks in schizophrenia

Mary-Ellen Lynall et al. J Neurosci. .

Abstract

Schizophrenia has often been conceived as a disorder of connectivity between components of large-scale brain networks. We tested this hypothesis by measuring aspects of both functional connectivity and functional network topology derived from resting-state fMRI time series acquired at 72 cerebral regions over 17 min from 15 healthy volunteers (14 male, 1 female) and 12 people diagnosed with schizophrenia (10 male, 2 female). We investigated between-group differences in strength and diversity of functional connectivity in the 0.06-0.125 Hz frequency interval, and some topological properties of undirected graphs constructed from thresholded interregional correlation matrices. In people with schizophrenia, strength of functional connectivity was significantly decreased, whereas diversity of functional connections was increased. Topologically, functional brain networks had reduced clustering and small-worldness, reduced probability of high-degree hubs, and increased robustness in the schizophrenic group. Reduced degree and clustering were locally significant in medial parietal, premotor and cingulate, and right orbitofrontal cortical nodes of functional networks in schizophrenia. Functional connectivity and topological metrics were correlated with each other and with behavioral performance on a verbal fluency task. We conclude that people with schizophrenia tend to have a less strongly integrated, more diverse profile of brain functional connectivity, associated with a less hub-dominated configuration of complex brain functional networks. Alongside these behaviorally disadvantageous differences, however, brain networks in the schizophrenic group also showed a greater robustness to random attack, pointing to a possible benefit of the schizophrenia connectome, if less extremely expressed.


Figures

Figure 1.
Figure 1.
Schematic of fMRI data analysis pipeline. Regional mean fMRI time series were estimated by applying a prior anatomical template image to each individual fMRI dataset after its coregistration with the template in standard space; wavelet analysis was used to bandpass filter the regional time series and to estimate frequency-specific measures of functional connectivity between regions; functional connectivity matrices were thresholded to generate binary undirected graphs or brain functional networks; between-group differences in functional connectivity, principal components, and network topological metrics were assessed by permutation testing.
Figure 2.
Figure 2.
Functional connectivity matrices and group differences in global connectivity. A, B, Matrices of pairwise correlations at 0.060–0.125 Hz for individual participants: healthy controls (A) and people with schizophrenia (B). Both axes represent the 72 regions used in the analysis, ordered by average strength in healthy subjects, and pixel color represents the level of correlation. C, D, Connectivity strength, (C), and average mutual information, (D), at four different wavelet scales for healthy volunteers (black) and people with schizophrenia (red). The group differences denoted by asterisks were significant at the wavelet scale 0.060–0.125 Hz for connectivity strength and mutual information (Table 2). Error bars indicate SD.
Figure 3.
Figure 3.
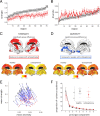
Group differences in regional connectivity metrics and global integration. A, Group mean connectivity strength for each of the 72 regions, ordered by mean regional strength in healthy volunteers; error bars indicate SEM. B, Regional diversity of correlations, ordered by mean diversity in healthy volunteers; error bars indicate SEM. C, Cortical surface renderings of strength. D, Cortical surface renderings of diversity. Regions showing a significant group difference in the metric when corrected for multiple comparisons using false-positive correction (p < 0.014) are indicated. E, Graph to show link between group differences in strength and diversity for individual regions. Lines connect equivalent anatomical regions in healthy volunteers (black) and people with schizophrenia (red). F, Principal components analysis: scree plot of the proportion of variance explained by successive principal components in people with schizophrenia (red) and healthy volunteers (black). Inset shows the group difference in the proportion of variance explained by the first principal component. Error bars indicate SD. For details, see Table 3 and supplemental Tables 6 and 7 (available at www.jneurosci.org as supplemental material).
Figure 4.
Figure 4.
Group differences in topological properties of brain functional networks. A, B, Pooled degree distributions (A) and cumulative degree distributions (B) for healthy volunteers (black) and people with schizophrenia (red), showing lower probability of high-degree network hubs in schizophrenia. C, D, Cortical surface renderings of degree (C) and clustering (D). Regions showing a significant group difference in the metric when corrected for multiple comparisons using false-positive correction (p < 0.014) are indicated. For details, see Table 3 and supplemental Table 8 (available at www.jneurosci.org as supplemental material).
Figure 5.
Figure 5.
Matrix of correlations between global functional connectivity metrics, topological metrics, and verbal fluency score across all participants. Nonsignificant correlations (p > 0.05) are left blank. The inset shows a scatter plot of verbal fluency versus connectivity strength, where the lines indicate the best linear fits for the data within each group (red, people with schizophrenia; black, healthy volunteers) and for the data pooled over both groups (green). For details, see supplemental Table 3 (available at www.jneurosci.org as supplemental material).
Figure 6.
Figure 6.
Hypothetical schematic of group differences in functional connectivity. People with schizophrenia show both higher diversity at each region and lower variance in connectivity strength across the brain. This can be conceptualized as a randomization or de-differentiation of functional connectivity.

Similar articles

Cited by

References

    1. Achard S. Brainwaver. Software package. 2007 Retrieved on November 30, 2009 from http://cran.r-project.org/
    1. Achard S, Bullmore E. Efficiency and cost of economical brain functional networks. PLoS Comput Biol. 2007;3:e17. - PMC - PubMed
    1. Achard S, Salvador R, Whitcher B, Suckling J, Bullmore E. A resilient, low-frequency, small-world human brain functional network with highly connected association cortical hubs. J Neurosci. 2006;26:63–72. - PMC - PubMed
    1. Achard S, Bassett DS, Meyer-Lindenberg A, Bullmore E. Fractal connectivity of long-memory networks. Phys Rev E Stat Nonlin Soft Matter Phys. 2008;77 036104. - PubMed
    1. American Psychiatric Association. Diagnostic and statistical manual of mental disorders. Ed 4. Washington, DC: American Psychiatric Association; 2000. text revision.

Publication types