. 2010 Oct;299(4):C828-35.
doi: 10.1152/ajpcell.00182.2010. Epub 2010 Jul 14.

A highly expressing Tet-inducible cell line recapitulates in situ developmental changes in prestin's Boltzmann characteristics and reveals early maturational events

Affiliations

A highly expressing Tet-inducible cell line recapitulates in situ developmental changes in prestin's Boltzmann characteristics and reveals early maturational events

Shumin Bian et al. Am J Physiol Cell Physiol. 2010 Oct.

Abstract

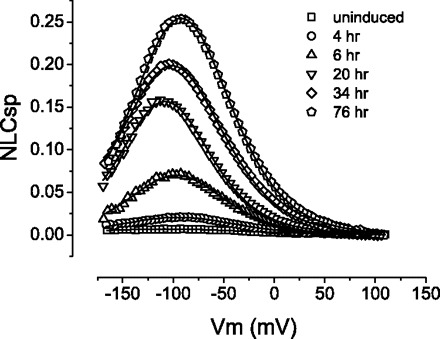
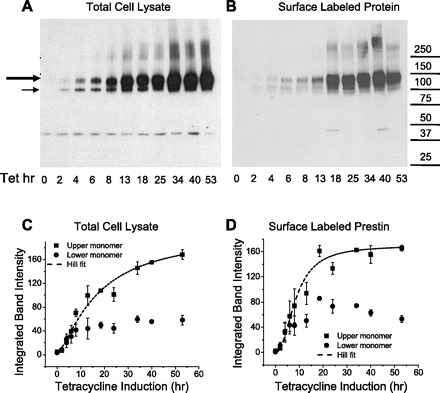
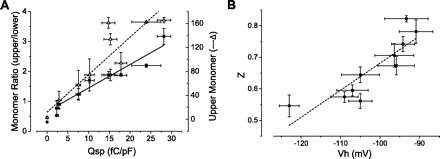
Prestin is the motor protein within the lateral membrane of outer hair cells (OHCs), and it is required for mammalian cochlear amplification. Expression of prestin precedes the onset of hearing in mice, and it has been suggested that prestin undergoes a functional maturation within the membrane coincident with the onset of hearing. We have developed a tetracycline-inducible prestin-expressing cell line that we have used to model prestin's functional maturation. We used prestin's voltage-dependent nonlinear charge movement (or nonlinear capacitance) as a test of function and correlated it to biochemical measures of prestin expressed on the cell surface. An initial stage of slow growth in charge density is accompanied by a rapid increase in our estimate of charge carried by an individual motor. A rapid growth in charge density follows and strongly correlates with an increasing ratio between an apparently larger and smaller monomer, suggesting that the latter exerts a dominant-negative effect on function. Finally, there is a gradual depolarizing shift in the voltage of peak capacitance, similar to that observed in developing OHCs. This inducible system offers many opportunities for detailed studies of prestin.


Figures

Fig. 1.
Fig. 1.
Prestin-yellow fluorescent protein (YFP) is localized to the membrane. Prestin-YFP expression in human embryonic kidney (HEK) 293 cell lines characterized by confocal imaging of YFP fluorescence is shown. A and B: a HEK293 cell line stably expressing a Flag-tagged prestin-YFP construct. C: untransfected HEK293 cells as negative control. DF: a tetracycline-inducible HEK293 cell line expressing prestin-YFP with a mycHis6 tag at its COOH terminus. D and E: 24 h after addition of 1 μg/ml tetracycline to the growth media. F: no tetracycline added as negative control. Scale bar, 20 μm.
Fig. 2.
Fig. 2.
Immunogold labeling localizes prestin to the plasma membrane. Electron microscopy (EM) images of a HEK293 cell line expressing Flag-tagged prestin-YFP are shown. Cells were grown to a monolayer in culture dishes, fixed, embedded, thin-sectioned, labeled with anti-green fluorescent protein (GFP) antibody (that cross-reacts with YFP) conjugated with 10 nm nanogold particles, stained, and imaged using a Tecnai 12 Bio Twin transmission electron microscope. AD: samples from cells expressing prestin-YFP. Nanogold labeling is clearly seen on the plasma membrane (filled arrows), indicating proper trafficking and targeting of prestin molecules to the cell membrane. Notice also scattered labeling in the cytoplasm and on some intracellular vesicles as pointed out by hollow arrows. E and F: in the untransfected HEK293 cells, very small amount of labeling was observed. N, nucleus; PM, plasma membrane; M, mitochondria. Scale bar, 250 nm.
Fig. 3.
Fig. 3.
Equivalent amounts of prestin are found in the plasma membrane and cytoplasm. Quantitative analysis on the distribution of prestin molecules in a Flag-tagged prestin-YFP stable cell line is shown. A: nanogold particle counting from EM images. Individual particles were counted from each micrograph, and the particles on the plasma membrane were subtracted from the total. As shown here, on average there are 56 gold particles in each micrograph of transfected cells, out of which 27 are localized on the cell membrane (∼50.6 ± 2.5%). B: the intensity of fluorescence was assayed on Flag-tagged prestin-YFP-expressing cells. The localization of YFP fluorescence was quantified in the plasma membranes of these cells. The plasma membranes of these cells contained 48.6 ± 1.9% of the total fluorescence signal (± SE).
Fig. 4.
Fig. 4.
Large nonlinear capacitance (NLC) is generated in cell lines expressing prestin. Shown are typical traces of NLC from two stable cell lines expressing prestin-YFP. The data were fitted according to Eq. 1. Top: trace from a noninducible HEK293 cell line (termed G) expressing Flag-tagged prestin-YFP. The fitting parameters were as follows: peak capacitance voltage (Vh) = −66.1 mV, unitary charge valence (z) = 0.801, maximum nonlinear charge (Qmax) = 0.468 pC, and linear capacitance (Clin) = 9.61 pF. Cm, membrane capacitance. Bottom: NLC trace from a tetracycline (Tet)-inducible HEK293 cell line expressing prestin-YFP tagged with mycHis6. Tetracycline (1 μg/ml) was added to the growth media, and NLC was measured 34 h after tetracycline induction. Fitting parameters were as follows: Vh = −75.3 mV, z = 0.804, Qmax = 0.365 pC, and Clin = 10.3 pF. Vm, cell membrane potential.
Fig. 5.
Fig. 5.
NLC increases as a function of time in inducible cell lines expressing prestin. Shown are representative NLC curves from a tetracycline-inducible HEK293 cell line (16c). Specific NLC (NLCsp) was used as a means to normalize data to cell size [NLCsp = (CmClin)/Clin]. Without tetracycline added to the growth media (uninduced), prestin expression is repressed, resulting in minimal measurement of NLC. As the incubation time with tetracycline lengthens, the cells develop higher NLC as a result of either more prestin expression and/or prestin maturation on the cell membrane. Fitting parameters according to Eq. 1 were the following: for 4 h, Vh (mV) = −93.8, z = 0.697, Qmax (pC) = 0.045, Clin (pF) = 18.0; for 6 h, Vh = −97.3, z = 0.799, Qmax = 0.213, Clin = 23.7; for 20 h, Vh = −108, z = 0.855, Qmax = 0.270, Clin = 14.6; for 34 h, Vh = −101, z = 0.753, Qmax = 0.528, Clin = 19.5; and for 76 h, Vh = −92.2, z = 0.780, Qmax = 0.548, Clin = 16.5.
Fig. 6.
Fig. 6.
NLC parameters change as a function of time after induction. A: development of specific charge density (Qsp) after induction in a representative tetracycline-inducible prestin cell line (16c) with time. Qsp increase shows a sigmoidal pattern with time and stabilizes at 30+ h. The number of cells patched for each point ranged from 4 to 11. Error bars are ±SE. Data were fitted to a Hill equation [y = start + (end − start) × xn/(kn + xn)] with the following parameters: start = 1.23; end = 32.0; k = 18.3; n = 2.0. B: development of unitary charge valence (z) in a tetracycline-inducible cell line as a function of time after induction. z shows a rapid increase over several hours to reach its plateau at 6–8 h. z values did not change significantly, remaining stable after this time point. Fitting parameters were as follows: start = 0.58; end = 0.80; k = 3.0; n = 6.8. C: development of voltage dependence of peak NLC (Vh) as a function of time after induction. While there was considerable variation in Vh values, there was a clear trend in the development of Vh values toward more depolarizing voltages with time. Fitting parameters were as follows: start = −123; end = −69.4; k = 8.6; n = 0.74.
Fig. 7.
Fig. 7.
Two monomers and multimers of prestin develop differentially as a function of time after induction (cell line 16c). A: Western blot of total cell lysate probed with anti-prestin N-20 antibody. Each lane has 0.75 μg of total protein as determined by protein assay. The large and small arrows indicate the upper (dominant) and lower monomers of prestin-YFP, respectively. A dimeric form of the protein is identifiable at 250 kDa. Prolonged incubation with tetracycline causes total cell prestin expression to increase steadily. The band at ∼40 kDa is a nonspecific artifact, because it appears also in untransfected HEK293 cells (data not shown). B: Western blot of surface-labeled prestin-YFP obtained from cells at different time points after induction with 1 μg/ml tetracycline. Each lane has 2 μl of the 250 μl surface-purified eluate from NeutrAvidin beads after binding to 2.7 mg of total protein. Each lane was derived from and corresponds to cell lysates in A. As with total cell lysates, prestin has at least two monomers and a broad dimeric form. The monomers in particular are detectable at the earliest time point (2 h) at which NLC is detectable. C and D: densitometric quantification of monomers of prestin from Western blots reveals a sigmoidal increase in the upper larger monomer of prestin. The surface expression of this monomer, however, stabilizes earlier than the monomer in cell lysates, with an asymptotic value achieved at 20 h after induction. The lower monomer expressed on the surface in contrast shows a small but persistent decrease in the asymptotic value with time. Hill fitting parameters for lysate (C) were as follows: start = 1; end = 205; k = 17.2; n = 1.4. Hill fitting parameters for surface prestin (D) were as follows: start = 0; end = 169; k = 8.6; n = 2.2. Data are averages from three batches of surface labeling experiments. Error bars are ±SE.
Fig. 8.
Fig. 8.
Prestin's lower monomer exerts a dominant-negative effect on the upper functional monomer. A: the relationship between Qsp and the densitometric ratio of the upper to lower prestin monomer expressed on the surface of the cell is linear (Qsp = −8.35 +11.12 × ratio; adjusted R2 = 0.93). Data were obtained from cells at variable time points after induction. Taken together, these data would suggest that the lower monomer exerts a dominant-negative effect on the function of the molecule. Also shown is the relationship between the upper monomer intensity and Qsp. There is an initial correlation between the two that decreases with higher Qsp values. B: correlation of z and Vh in the initial phase after induction where there is a rapid increase in z that correlates with a change in Vh.

References

    1. Abe T, Kakehata S, Kitani R, Maruya S, Navaratnam D, Santos-Sacchi J, Shinkawa H. Developmental expression of the outer hair cell motor prestin in the mouse. J Membr Biol 215: 49–56, 2007 - PMC - PubMed
    1. Belyantseva IA, Adler HJ, Curi R, Frolenkov GI, Kachar B. Expression and localization of prestin and the sugar transporter GLUT-5 during development of electromotility in cochlear outer hair cells. J Neurosci 20: RC116, 2000 - PMC - PubMed
    1. Blatchley BJ, Cooper WA, Coleman JR. Development of auditory brainstem response to tone pip stimuli in the rat. Brain Res 429: 75–84, 1987 - PubMed
    1. Brownell WE, Bader CR, Bertrand D, de Ribaupierre Y. Evoked mechanical responses of isolated cochlear outer hair cells. Science 227: 194–196, 1985 - PubMed
    1. Dallos P, Wu X, Cheatham MA, Gao J, Zheng J, Anderson CT, Jia S, Wang X, Cheng WH, Sengupta S, He DZ, Zuo J. Prestin-based outer hair cell motility is necessary for mammalian cochlear amplification. Neuron 58: 333–339, 2008 - PMC - PubMed

Publication types

MeSH terms

LinkOut - more resources