Induction of liver steatosis and lipid droplet formation in ATF6alpha-knockout mice burdened with pharmacological endoplasmic reticulum stress
- PMID: 20631254
- PMCID: PMC2929991
- DOI: 10.1091/mbc.E09-02-0133
Induction of liver steatosis and lipid droplet formation in ATF6alpha-knockout mice burdened with pharmacological endoplasmic reticulum stress
Abstract
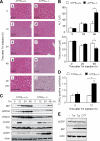
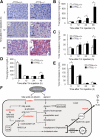
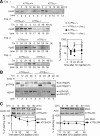
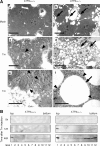
Accumulation of unfolded proteins in the endoplasmic reticulum (ER) activates homeostatic responses collectively termed the unfolded protein response. Among the three principal signaling pathways operating in mammals, activating transcription factor (ATF)6alpha plays a pivotal role in transcriptional induction of ER-localized molecular chaperones and folding enzymes as well as components of ER-associated degradation, and thereby mouse embryonic fibroblasts deficient in ATF6alpha are sensitive to ER stress. However, ATF6alpha-knockout mice show no apparent phenotype under normal growing conditions. In this report, we burdened mice with intraperitoneal injection of the ER stress-inducing reagent tunicamycin and found that wild-type mice were able to recover from the insult, whereas ATF6alpha-knockout mice exhibited liver dysfunction and steatosis. Thus, ATF6alpha-knockout mice accumulated neutral lipids in the liver such as triacylglycerol and cholesterol, which was ascribable to blockage of beta-oxidation of fatty acids caused by decreased mRNA levels of the enzymes involved in the process, suppression of very-low-density lipoprotein formation due to destabilized apolipoprotein B-100, and stimulation of lipid droplet formation resulting from transcriptional induction of adipose differentiation-related protein. Accordingly, the hepatocytes of tunicamycin-injected knockout mice were filled with many lipid droplets. These results establish links among ER stress, lipid metabolism, and steatosis.
Figures


Similar articles
-
Induction of Liver Steatosis in BAP31-Deficient Mice Burdened with Tunicamycin-Induced Endoplasmic Reticulum Stress.Int J Mol Sci. 2018 Aug 4;19(8):2291. doi: 10.3390/ijms19082291. Int J Mol Sci. 2018. PMID: 30081561 Free PMC article.
-
Transcriptional induction of mammalian ER quality control proteins is mediated by single or combined action of ATF6alpha and XBP1.Dev Cell. 2007 Sep;13(3):365-76. doi: 10.1016/j.devcel.2007.07.018. Dev Cell. 2007. PMID: 17765680
-
ATF6alpha optimizes long-term endoplasmic reticulum function to protect cells from chronic stress.Dev Cell. 2007 Sep;13(3):351-64. doi: 10.1016/j.devcel.2007.07.005. Dev Cell. 2007. PMID: 17765679
-
The essential functions of endoplasmic reticulum chaperones in hepatic lipid metabolism.Dig Liver Dis. 2016 Jul;48(7):709-16. doi: 10.1016/j.dld.2016.03.016. Epub 2016 Mar 31. Dig Liver Dis. 2016. PMID: 27133206 Review.
-
Sledgehammer to Scalpel: Broad Challenges to the Heart and Other Tissues Yield Specific Cellular Responses via Transcriptional Regulation of the ER-Stress Master Regulator ATF6α.Int J Mol Sci. 2020 Feb 8;21(3):1134. doi: 10.3390/ijms21031134. Int J Mol Sci. 2020. PMID: 32046286 Free PMC article. Review.
Cited by
-
The unfolded protein response and hepatic lipid metabolism in non alcoholic fatty liver disease.Pharmacol Ther. 2019 Nov;203:107401. doi: 10.1016/j.pharmthera.2019.107401. Epub 2019 Aug 13. Pharmacol Ther. 2019. PMID: 31419516 Free PMC article. Review.
-
Role of endoplasmic reticulum stress in the pathogenesis of nonalcoholic fatty liver disease.World J Gastroenterol. 2014 Feb 21;20(7):1768-76. doi: 10.3748/wjg.v20.i7.1768. World J Gastroenterol. 2014. PMID: 24587654 Free PMC article. Review.
-
Mechanisms, regulation and functions of the unfolded protein response.Nat Rev Mol Cell Biol. 2020 Aug;21(8):421-438. doi: 10.1038/s41580-020-0250-z. Epub 2020 May 26. Nat Rev Mol Cell Biol. 2020. PMID: 32457508 Free PMC article. Review.
-
The Role of Organelle Stresses in Diabetes Mellitus and Obesity: Implication for Treatment.Anal Cell Pathol (Amst). 2015;2015:972891. doi: 10.1155/2015/972891. Epub 2015 Nov 3. Anal Cell Pathol (Amst). 2015. PMID: 26613076 Free PMC article. Review.
-
ER stress in skeletal muscle remodeling and myopathies.FEBS J. 2019 Jan;286(2):379-398. doi: 10.1111/febs.14358. Epub 2017 Dec 29. FEBS J. 2019. PMID: 29239106 Free PMC article. Review.
References
-
- Adachi Y., Yamamoto K., Okada T., Yoshida H., Harada A., Mori K. ATF6 is a Transcription Factor Specializing in the Regulation of Quality Control Proteins in the Endoplasmic Reticulum. Cell Struct. Funct. 2008;33:75–89. - PubMed
-
- Bligh E. G., Dyer W. J. A rapid method of total lipid extraction and purification. Can. J. Biochem. Physiol. 1959;37:911–917. - PubMed
-
- Borchardt R. A., Davis R. A. Intrahepatic assembly of very low density lipoproteins. Rate of transport out of the endoplasmic reticulum determines rate of secretion. J. Biol. Chem. 1987;262:16394–16402. - PubMed
Publication types
MeSH terms
Substances
LinkOut - more resources
Full Text Sources
Other Literature Sources
Molecular Biology Databases
Research Materials

