. 2010 Nov 11;116(19):3875-86.
doi: 10.1182/blood-2010-01-265041. Epub 2010 Jul 14.

Adoptive transfer of syngeneic T cells transduced with a chimeric antigen receptor that recognizes murine CD19 can eradicate lymphoma and normal B cells

Affiliations

Adoptive transfer of syngeneic T cells transduced with a chimeric antigen receptor that recognizes murine CD19 can eradicate lymphoma and normal B cells

James N Kochenderfer et al. Blood. .

Abstract

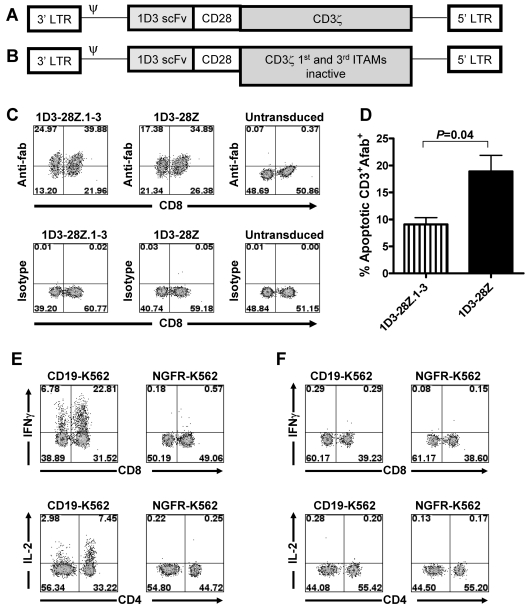
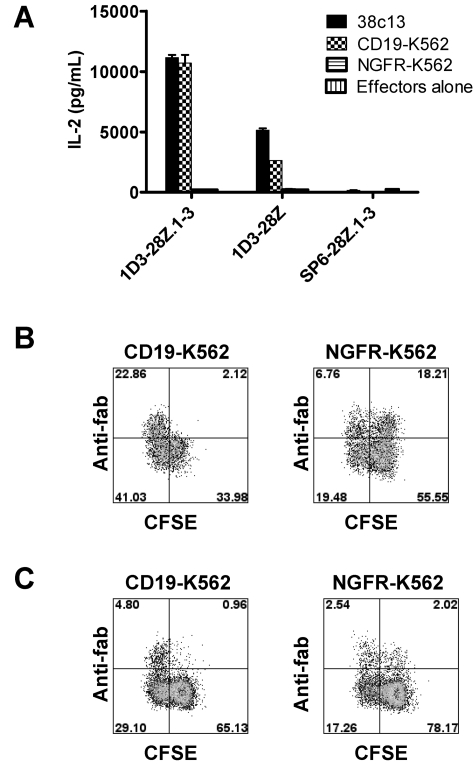
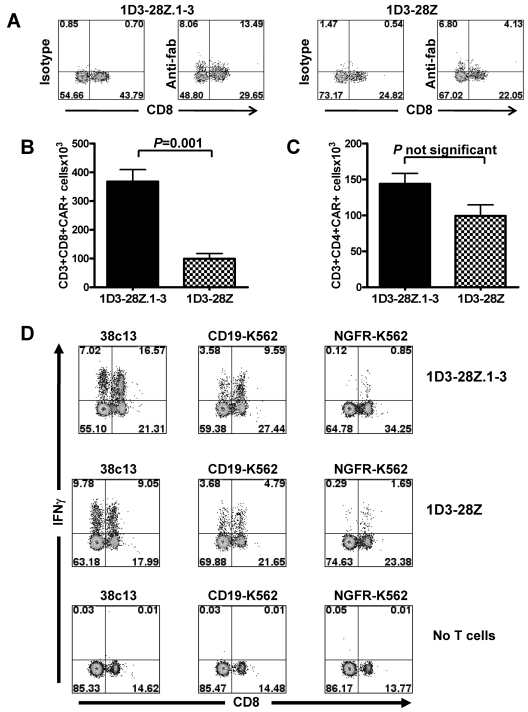
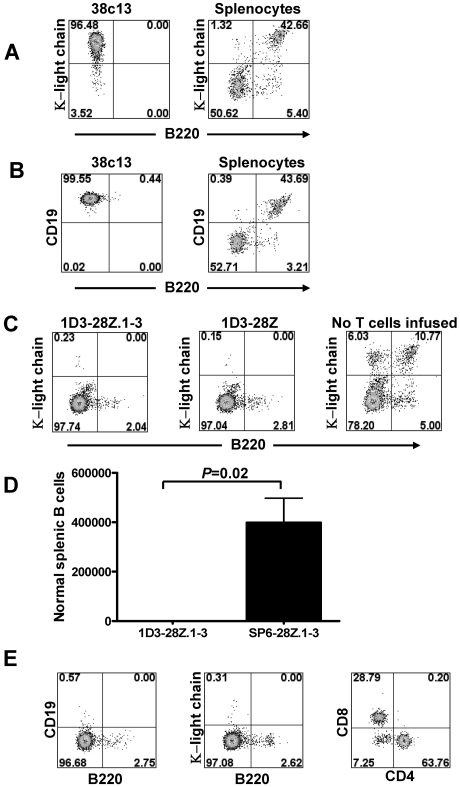
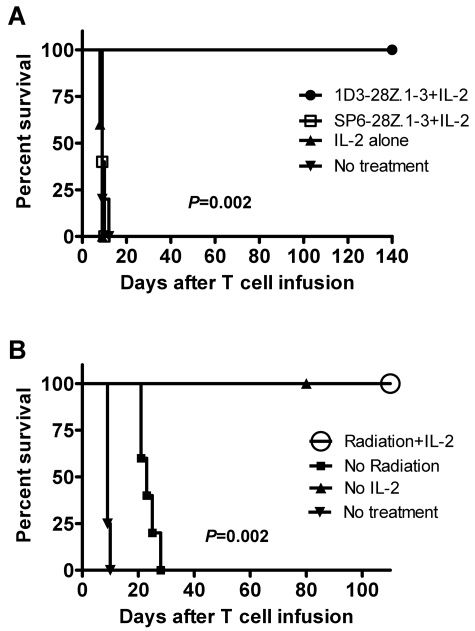
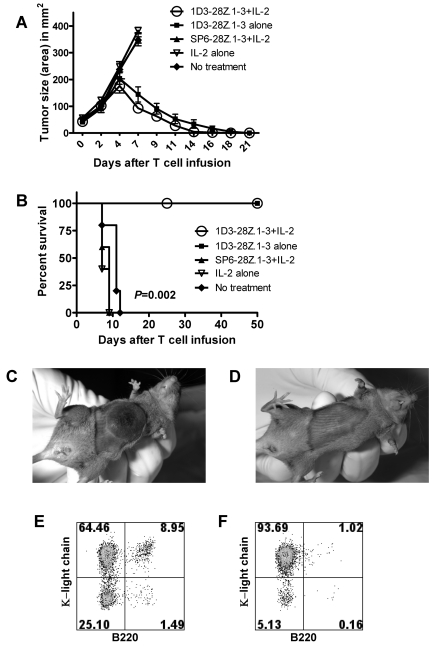
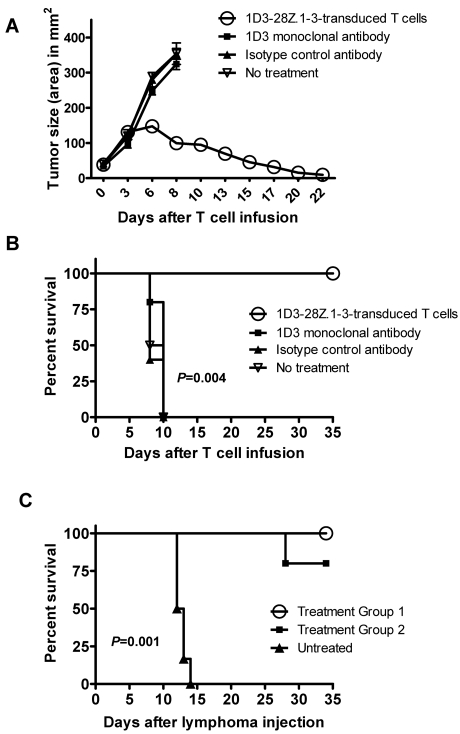
Adoptive T-cell therapy with anti-CD19 chimeric antigen receptor (CAR)-expressing T cells is a new approach for treating advanced B-cell malignancies. To evaluate anti-CD19-CAR-transduced T cells in a murine model of adoptive T-cell therapy, we developed a CAR that specifically recognized murine CD19. We used T cells that were retrovirally transduced with this CAR to treat mice bearing a syngeneic lymphoma that naturally expressed the self-antigen murine CD19. One infusion of anti-CD19-CAR-transduced T cells completely eliminated normal B cells from mice for at least 143 days. Anti-CD19-CAR-transduced T cells eradicated intraperitoneally injected lymphoma cells and large subcutaneous lymphoma masses. The antilymphoma efficacy of anti-CD19-CAR-transduced T cells was critically dependent on irradiation of mice before anti-CD19-CAR-transduced T-cell infusion. Anti-CD19-CAR-transduced T cells had superior antilymphoma efficacy compared with the anti-CD19 monoclonal antibody from which the anti-CD19 CAR was derived. Our results demonstrated impressive antilymphoma activity and profound destruction of normal B cells caused by anti-CD19-CAR-transduced T cells in a clinically relevant murine model.


Figures

Figure 1
Figure 1
Anti-CD19 CARs were expressed by T cells and specifically recognized murine CD19. (A) Diagram of the DNA encoding the 1D3-28Z CAR (ψ, retroviral packaging signal). (B) Diagram of the DNA encoding the 1D3-28Z.1-3 CAR. (C) Splenic T cells were placed in culture with anti-CD3/anti-CD28 beads. The cells were transduced 1 day later with retroviruses encoding 1D3-28Z.1-3 or 1D3-28Z. The transduction was repeated the next day. The third day after culture initiation, the cells were analyzed for CAR expression by staining with anti–rat Fab antibodies (top row) or isotype control antibodies (bottom row). Other cells were cultured and analyzed identically but left untransduced. The plots are gated on CD3+ cells, which made up greater than 98% of the total cells in the cultures. The numbers on the plots are the percentages of cells in each quadrant. Data are representative of 5 experiments. (D) T cells from 3 different mice were transduced separately with retroviruses encoding either 1D3-28Z.1-3 or 1D3-28Z. The mean percentages of CAR-expressing CD3+ cells that were apoptotic as indicated by staining with annexin V after 7 days of culture are shown. (E) Splenic T cells were cultured and transduced with 1D3-28Z.1-3 or cultured identically but not transduced. (F) The third day after the cultures were initiated, the T cells were stimulated with either the CD19+ cell line CD19-K562 or the CD19 cell line NGFR-K562. Intracellular cytokine staining for IFN-γ and IL-2 was carried out. The plots are gated on CD3+ cells, and the numbers on the plots are the percentages of cells in each quadrant. Results are representative of 2 experiments.
Figure 2
Figure 2
Anti-CD19–CAR-expressing T cells produce IL-2 and proliferate in response to CD19. T cells were cultured with anti-CD3/anti-CD28 beads and transduced with retroviruses encoding 1D3-28Z.1-3, 1D3-28Z, or SP6-28Z.1-3. On day 5 of culture, 46% of 1D3-28Z.1-3-transduced cells expressed detectable levels of CAR protein and 19% of 1D3-28Z–transduced cells expressed detectable levels of CAR protein. On day 5 of culture, CAR-transduced cells were used in an IL-2 ELISA and a carboxyfluorescein succinimidyl ester (CFSE) proliferation assay. (A) 1D3-28Z.1-3–transduced T cells, 1D3-28Z–transduced T cells, or SP6-28Z.1-3–transduced T cells were cultured overnight alone or with the indicated target cells, and an IL-2 ELISA was performed. The 38c13 and CD19-K562 cells were CD19+ and NGFR-K562 cells were CD19. The units are in picograms per milliliter. Error bars represent the SEM of duplicate wells. 1D3-28Z.1-3–transduced T cells and 1D3-28Z–transduced T cells produced IL-2 in response to CD19. Minimal IL-2 production occurred when T cells were cultured alone or with NGFR-K562 cells. This is 1 of 2 experiments with similar results. (B) CFSE-labeled 1D3-28Z.1-3–transduced T cells were cultured for 4 days with either irradiated CD19-K562 cells or irradiated NGFR-K562 cells as indicated above each plot. The cells were stained with anti-Fab antibodies to detect the CAR. Almost all 1D3-28Z.1-3–expressing T cells that were cultured with CD19-K562 cells proliferated as indicated by CFSE dilution. Only a minority of 1D3-28Z.1-3–expressing T cells that were cultured with NGFR-K562 cells proliferated. The plots are gated on CD3+ lymphocytes, and the numbers on the plots are the percentages of cells in each quadrant. Results are representative of 2 experiments. (C) Only a small fraction of T cells expressed 1D3-28Z after 4 days of culture with either CD19-K562 cells or NGFR-K562 cells. More of the persisting cells underwent proliferation when they were cultured with CD19-K562 cells than when they were cultured with NGFR-K562 cells. The plots are gated on CD3+ lymphocytes, and the numbers on the plots are the percentages of cells in each quadrant.
Figure 3
Figure 3
Functional anti-CD19–CAR-transduced T cells were detected in mice after adoptive transfer. (A) T cells were cultured and transduced as described in Figure 1C. Two groups of mice received 5 Gy of TBI. After the TBI, the mice were injected intraperitoneally with 38c13 lymphoma cells. The next day, one group of mice received T cells transduced 1D3-28Z.1-3, and the other group received T cells transduced with 1D3-28Z. Both groups received IL-2 on the day of T-cell infusion and the next day. Eight days after the T-cell transfer, the mice were killed and splenocytes were stained with mouse anti–rat Fab antibodies to detect CAR-transduced cells. Splenocytes were also stained with isotype control antibodies. The plots are gated on CD3+ cells, and the numbers on the plots represent the percentage of total CD3+ cells. The results are representative of 3 experiments. (B) Mean absolute numbers of CAR-expressing CD3+CD8+ splenocytes in mice that received either 1D3-28Z.1-3–transduced T cells or 1D3-28Z–transduced T cells. Mice were treated as described in Figure 3A. (C) Mean absolute numbers of CAR-expressing CD3+CD4+ splenocytes in mice that received either 1D3-28Z.1-3–transduced T cells or 1D3-28Z–transduced T cells. Mice were treated as described in Figure 3A. Results are representative of 3 experiments. (D) Three groups of mice received radiation and intraperitoneal injections of 38c13 lymphoma cells as described in Figure 3A. The mice were then injected with 1D3-28Z.1-3–transduced T cells (top row), 1D3-28Z–transduced T cells (middle row), or no T cells (bottom row). Eight days after T-cell transfer, the mice were killed, and splenocytes were cultured with 38c13, CD19-K562, or NGFR-K562. 38c13 and CD19-K562 were CD19+. NGFR-K562 was CD19. Intracellular cytokine staining was performed for IFN-γ. The numbers on the plots represent the percentage of CD3+ cells. This is 1 of 2 representative experiments.
Figure 4
Figure 4
Anti-CD19 CARs eradicated lymphoma cells and normal B cells. (A) The 38c13 lymphoma expressed κ light chain but not B220. In contrast, normal splenocytes did not have a substantial population of cells that expressed κ light chain but not B220. Almost all normal B cells expressed both κ light chain and B220. The numbers on the plots are the percentages of live cells in each quadrant. (B) The 38c13 lymphoma expressed CD19 but not B220. Normal splenocytes did not have a substantial population of CD19-expressing B220 cells. Normal B cells are CD19+B220+. The numbers on the plots are the percentages of live cells in each quadrant. (C) Mice received 5 Gy of TBI, and later the same day the mice were injected intraperitoneally with 38c13 cells. One day after the lymphoma injection, groups of mice were injected intravenously with either 1D3-28Z.1-3-transduced T cells or 1D3-28Z–transduced T cells. Each mouse was injected with 6 × 10⁶ total T cells. The mice received IL-2 once daily on the day of T-cell transfer and the next day. A control group that did not receive any T cells was also included. Eight days later, the mice were killed and splenocytes were analyzed by flow cytometry. The plots are gated on live lymphocytes. The numbers on the plots are the percentages of live cells in each quadrant. Nearly identical results were obtained in 2 separate experiments in which 5 mice were injected with either 1D3-28Z.1-3–transduced T cells or 1D3-28Z–transduced T cells. (D) Mice received 5 Gy of TBI, and later the same day the mice were injected intraperitoneally with 38c13 cells. The next day, groups of mice were injected intravenously with T cells that were transduced with either the anti-CD19 CAR 1D3-28Z.1-3 or the negative-control CAR SP6-28Z.1-3. The mice received IL-2 once daily on the day of T-cell transfer and the next day. The mice were killed 8 days after T-cell transfer. Splenocytes were stained with anti-κ light chain and B220 to detect normal B cells. The graph summarizes the numbers of splenic B cells from mice in a single experiment in which 3 mice received 1D3-28Z.1-3–transduced T cells and 4 mice received SP6-28Z.1-3–transduced T cells. Nearly identical results were obtained in 2 separate experiments. (E) Mice were irradiated and then injected intraperitoneally with 38c13 lymphoma. The next day, the mice received 1D3-28Z.1-3–transduced T cells. The mice received IL-2 on the day of T-cell transfer and the next day. One hundred forty-three days later, the mice were killed and splenocytes were analyzed for B cells and T cells by flow cytometry. A representative example of 5 mice tested is shown. The CD19 versus B220 plot and the κ light chain versus B220 plot are gated on live lymphocytes. The CD8 versus CD4 plot is gated on CD3+ cells. The numbers on the plots are the percentages of cells in each quadrant.
Figure 5
Figure 5
Complete eradication of lymphoma by anti-CD19–CAR-transduced T cells only occurred when mice were irradiated before adoptive T-cell transfer. (A) Mice received 5 Gy of TBI, and later the same day the mice were injected intraperitoneally with 38c13 lymphoma cells. The next day, the mice were divided into 4 treatment groups. One group was injected intravenously with 1D3-28Z.1-3–transduced T cells. Mice in this group received IL-2 on the day of T-cell transfer and the next day. A second group received T cells that were transduced with the control CAR SP6-28Z.1-3 plus IL-2. A third group received IL-2 alone, and a fourth group was left untreated. Each group included 5 mice. The P value of .002 refers to the comparison of the group that received 1D3-28Z.1-3–transduced T cells plus IL-2 to the group that received SP6-28Z.1-3–transduced T cells plus IL-2. The results from 1 of 2 experiments with nearly identical results are shown. (B) Mice were separated into 4 groups. The Radiation + IL-2 group received 5 Gy of TBI followed by an intraperitoneal injection of 38c13 cells. The Radiation + IL-2 group was injected intravenously with 1D3-28Z.1-3–transduced T cells the day after lymphoma injection. A dose of IL-2 was administered immediately after the T-cell injection, and a second dose of IL-2 was administered 1 day later. The No radiation group was treated identically to the Radiation + IL-2 group, except that TBI was not administered. The No IL-2 group was treated identically to the Radiation + IL-2 group, except that phosphate-buffered saline injections were administered in place of IL-2 injections. The No treatment group was left untreated. There were 5 mice in each group, except the No treatment group that included 4 mice. There was 100% survival of both the Radiation + IL-2 group and the No IL-2 group. The results are from 1 of 2 nearly identical experiments. The P value of .002 is for the comparison of the Radiation + IL-2 group to the No radiation group.
Figure 6
Figure 6
Anti-CD19–CAR-transduced T cells eradicated large lymphoma masses. (A) Mice received 5 Gy of TBI, and later the same day the mice were injected subcutaneously with 38c13 lymphoma cells. Four days later when visible tumors had formed, the mice received 1 of 4 treatments, or they were left untreated. The 1D3-28Z.1-3 + IL-2 group received an intravenous infusion of 1D3-28Z.1-3–transduced T cells. These mice also received IL-2 daily for 3 days. The first IL-2 injection was administered immediately after the T-cell infusion. The 1D3-28Z.1-3 alone group received 1D3-28Z.1-3–transduced T cells with phosphate-buffered saline injections substituted for IL-2. The SP6-28Z.1-3 + IL-2 group received infusions of the negative control CAR SP6-28Z.1-3 and IL-2. A group of mice received IL-2 alone. The mean tumor sizes of each group are shown. The tumor size curves of the control groups end when the first mouse from a group was killed. There were 5 mice in each group, and these results are representative of 2 experiments with nearly identical results. (B) The survival of the same groups of mice described in panel A is shown. The P value refers to the comparison of the 1D3-28Z.1-3 + IL-2 group and the No treatment group. The 1D3-28Z.1-3 + IL-2 group and the 1D3-28Z.1-3 alone group both had 100% survival. (C) Representative example of a lymphoma mass of a mouse from the SP6-28Z.1-3 + IL-2 group 7 days after T-cell infusion. (D) Representative example of a lymphoma site of a mouse from the 1D3-28Z.1-3 + IL-2 group 7 days after T-cell infusion. (E) Representative examples of κ light chain versus B220 staining of spleen and (F) inguinal lymph nodes demonstrate that subcutaneously injected 38c13 lymphoma cells have metastasized widely in mice from the SP6-28Z.1-3 + IL-2 group 8 days after T-cell infusion. The 38c13 lymphoma cells express kappa light chain but not B220. The plots are gated on live lymphocytes. The numbers on the plots are the percentages of cells in each quadrant.
Figure 7
Figure 7
1D3-28Z.1-3–transduced T cells are superior to the 1D3 monoclonal antibody at treating lymphoma. Mice received 5 Gy of TBI, and later the same day they were injected subcutaneously with 38c13 lymphoma cells. Four days later when the mice had established lymphoma masses, they were separated into 4 treatment groups. One group received 1D3-28Z.1-3–transduced T cells. A second group received an injection of the 1D3 monoclonal antibody. A third group received an isotype-matched control antibody, and the fourth group was left untreated. Tumor sizes (A) and survival (B) of each group are shown. The P value of .004 refers to the comparison of the 1D3-28Z.1-3–transduced T-cell group and the 1D3 monoclonal antibody group. The tumor size curves of antibody-treated and untreated mice end when the first mouse of a group was killed. This is 1 of 2 representative experiments with 5 mice per group, except the No treatment group that contained 4 mice. (C) Mice that were successfully treated for lymphoma with 1D3-28Z.1-3–transduced T cells were resistant to lymphoma rechallenge. Three groups of mice received an intraperitoneal injection of 100 000 38c13 cells. Untreated mice had not received any prior treatment. Twenty weeks before rechallenge, mice in Treatment group 1 had lymphoma masses eradicated after treatment with 1D3-28Z.1-3-transduced T cells and IL-2 as detailed in Figure 6A. Sixteen weeks before rechallenge, mice in Treatment group 2 had lymphoma masses eradicated after treatment with 1D3-28Z.1-3 transduced T cells without IL-2 as described in panel A. The survival of the 3 groups is shown. The P value refers to the comparison of the untreated mice and the Treatment group 2.

References

    1. Sadelain M, Brentjens R, Riviere I. The promise and potential pitfalls of chimeric antigen receptors. Curr Opin Immunol. 2009;21(2):215–223. - PMC - PubMed
    1. Kershaw MH, Teng MWL, Smyth MJ, Darcy PK. Supernatural T cells: genetic modification of T cells for cancer therapy. Nat Rev Immunol. 2005;5(12):928–940. - PubMed
    1. Rossig C, Bar A, Pscherer S, et al. Target antigen expression on a professional antigen-presenting cell induces superior proliferative antitumor T-cell responses via chimeric T-cell receptors. J Immunother. 2006;29(1):21–31. - PubMed
    1. Loskog A, Giandomenico V, Rossig C, Pule M, Dotti G, Brenner MK. Addition of the CD28 signaling domain to chimeric T-cell receptors enhances chimeric T-cell resistance to T regulatory cells [see comment]. Leukemia. 2006;20(10):1819–1828. - PubMed
    1. Lamers CH, Langeveld SC, Groot-van Ruijven CM, Debets R, Sleijfer S, Gratama JW. Gene-modified T cells for adoptive immunotherapy of renal cell cancer maintain transgene-specific immune functions in vivo. Cancer Immunol Immunother. 2007;56(12):1875–1883. - PMC - PubMed

Publication types