. 2010 Aug 19;466(7309):987-91.
doi: 10.1038/nature09290. Epub 2010 Jul 14.

Regulation of heterochromatic DNA replication by histone H3 lysine 27 methyltransferases

Affiliations

Regulation of heterochromatic DNA replication by histone H3 lysine 27 methyltransferases

Yannick Jacob et al. Nature. .

Abstract

Multiple pathways prevent DNA replication from occurring more than once per cell cycle. These pathways block re-replication by strictly controlling the activity of pre-replication complexes, which assemble at specific sites in the genome called origins. Here we show that mutations in the homologous histone 3 lysine 27 (H3K27) monomethyltransferases, ARABIDOPSIS TRITHORAX-RELATED PROTEIN5 (ATXR5) and ATXR6, lead to re-replication of specific genomic locations. Most of these locations correspond to transposons and other repetitive and silent elements of the Arabidopsis genome. These sites also correspond to high levels of H3K27 monomethylation, and mutation of the catalytic SET domain is sufficient to cause the re-replication defect. Mutation of ATXR5 and ATXR6 also causes upregulation of transposon expression and has pleiotropic effects on plant development. These results uncover a novel pathway that prevents over-replication of heterochromatin in Arabidopsis.


Figures

Figure 1
Figure 1. Heterochromatic DNA is over-produced in atxr5 atxr6 mutants
(a) Flow cytometry profiles of Col, atxr5, atxr6, atxr5 atxr6, and ddm1-2 plants. 3000 gated events are plotted. The number above each peak (Robust CV) indicates the number of fluorescence intensity units that enclose the central 68% of nuclei for that endoreduplication level. (b) Quantification of nuclei at each ploidy level for samples in Fig. 1a; Col (black), atxr5 (white), atxr6 (grey), atxr5 atxr6 (crosshatched). (c) DAPI staining of sorted nuclei from Col and atxr5 atxr6 leaves. Scale bar = 10μm. (d) Chromocenter decondensation occurs mainly in 8C and 16C nuclei. 30 nuclei of each ploidy level from three biological replicates were analyzed. White bars represent wild-type, and black bars represent atxr5 atxr6. Error bars indicate one standard deviation. (e) DNA is replicated uniformly in wild type nuclei during endoreduplication. The log2 ratios of genomic DNA Illumina reads from wild-type 4C vs 2C, 8C vs 2C and 16C vs 2C are plotted across the chromosomes in 100kb-sliding windows. Plots of transposable element (TE) abundance (kilobases of transposon sequence per 100 kilobase genomic DNA) indicate pericentromeric regions. (f) Similar analysis with atxr5 atxr6 mutants showing an increased proportion of reads in pericentromeric heterochromatin in higher ploidy nuclei.
Figure 2
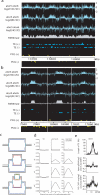
Figure 2. Increased heterochromatic DNA in atxr5 atxr6 mutants is consistent with re-replication of chromatin
(a) Genome browser view of a region of pericentromeric heterochromatin. Pericentromeric heterochromatin contains densely spaced, ~10kb over-replicating sites. Data are represented as log2 ratios (16C/2C, 8C/2C or 4C/2C) in 200bp bins. H3K9me2 microarray data, TAIR8 protein-coding gene (PCG) and transposable element (TE) tracks are also shown on the plus (+) or minus (-) strand of the genome. (b) Genome browser view of examples of over-replication in the arms of chromosomes. Three over-replicating regions are shown. (c) Model for DNA re-replication (adapted from21). (d) Distribution of Illumina reads in re-replicating regions. Plots of the average number of sequence reads +/-5 kilobases relative to the center of over-replicating regions in atxr5 atxr6 mutants, wild type, or the atxr5 atxr6 mutants/wild type log2 ratio (plotted in 100bp bins). (e) Histone content in re-replicating regions is higher in atxr5 atxr6 mutants. Log2 ratios of H3 ChIP-seq reads and input genomic DNA reads in atxr5 atxr6 mutants relative to wild-type, plotted over chromosome 3 in 100kb-sliding windows.
Figure 3
Figure 3. Genome-wide mapping of H3K27me1 and anticorrelation with H3K4 methylation
(a) H3K27me1 is enriched in heterochromatin. The log2 ratios of H3K27me1 reads to H3 ChIP-seq reads in wild-type are plotted across the chromosomes (1 to 5) in 100kb-sliding windows. (b) H3K27me1 is anticorrelated with gene expression level. H3K27me1 ChIP-seq reads normalized to H3 ChIP-seq reads averaged over TAIR8 protein-coding genes. The bodies of genes are scaled. Three-week-old wild type plants were used for both ChIP-seq and RNA-seq. (c) H3K27me1 is significantly enriched at sites of re-replication in the arms. Reads per base pair in re-replicating regions were calculated for both H3K27me1 and H3 ChIP-seq reads, and the ratio was calculated (black bar). Random regions with similar a distribution as re-replicating regions were generated 100,000 times and the same calculation was performed. The mean value obtained from random regions are shown (white bar) and the error bars represent the standard deviation. (d) H3K27me1 is enriched in over re-replicating regions. The log2 ratio of H3K27me1 to H3 reads is plotted +/-20 kilobases relative to the center of re-replicating regions atxr5 atxr6 mutants. Data were plotted in 400bp bins and smoothed by taking the moving average over 6 bins. (e) Pull-down assay using purified GST-tagged PHD domains of ATXR5 and ATXR6 and biotinylated H3 peptides with different methylated lysines. Interaction between the peptides and the GST-PHD domains was visualized by Western blot using a GST antibody. (f) Analysis of the relationship between H3K27me1 and H3K4 methylation. The log2 ratio of H3K27me1 to H3 is plotted over the boundaries of all H3K4me0/-me1/-me2/-me3 regions in the genome. Data is graphed in 200 base pair bins, and smoothed by taking the moving average over +/-2 bins. The scale for the plots over H3K4me0 is in blue, and the scale for the others is in black.
Figure 4
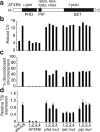
Figure 4. Functional PHD- and SET domains, and the PIP motif are required for the regulation of DNA replication by ATXR6
(a) Structure of ATXR6. The domains (below) and point mutations (above) made to generate ATXR6 mutants are represented. (b, c, d) Normal DNA replication as indicated by Robust CV (b), chromatin condensation (c) and TSI gene silencing (d) are rescued in transgenic atxr5 atxr6 plants expressing wild-type ATXR6, but not PHD-, SET-, or PIP mutants. All phenotypes were scored on the same four representative transgenic lines (n>20) generated from each construct. Error bars indicate one standard deviation.

Similar articles

Cited by

References

    1. Jeddeloh JA, Stokes TL, Richards EJ. Nat Genet. 1999 May;22:94. - PubMed
    1. Vongs A, Kakutani T, Martienssen RA, Richards EJ. Science. 1993 Jun 25;260:1926. - PubMed
    1. Jacob Y, et al. Nat Struct Mol Biol. Jun 7;:2009. - PMC - PubMed
    1. Lan F, et al. Nature. 2007 Aug 9;448:718. - PMC - PubMed
    1. Dillon SC, Zhang X, Trievel RC, Cheng X. Genome Biol. 2005;6:227. - PMC - PubMed

Publication types

MeSH terms

Associated data