

Neural substrates of reliability-weighted visual-tactile multisensory integration
- PMID: 20631844
- PMCID: PMC2903191
- DOI: 10.3389/fnsys.2010.00025
Neural substrates of reliability-weighted visual-tactile multisensory integration
Abstract
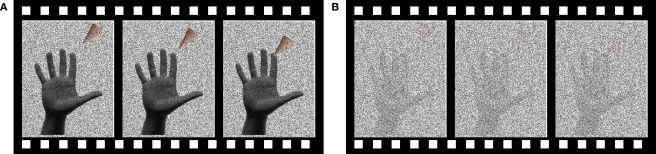
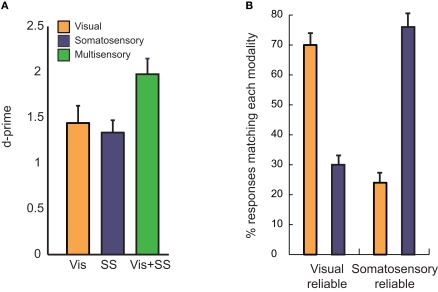
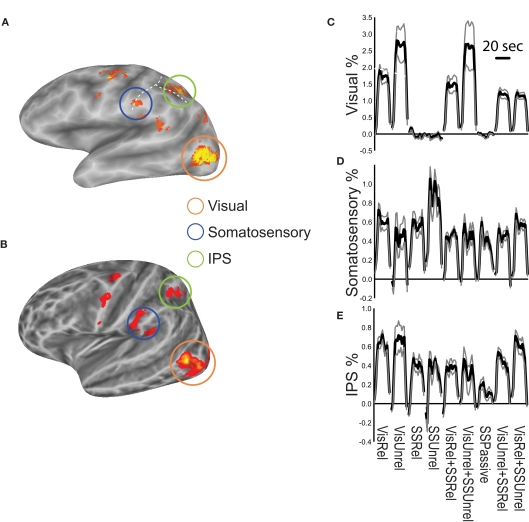
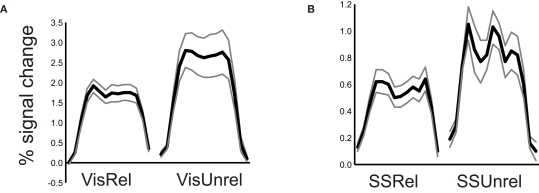
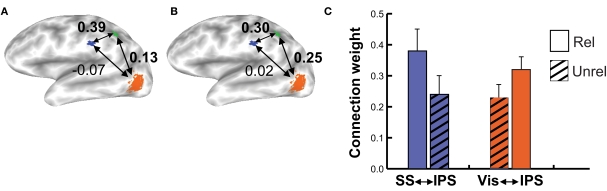
As sensory systems deteriorate in aging or disease, the brain must relearn the appropriate weights to assign each modality during multisensory integration. Using blood-oxygen level dependent functional magnetic resonance imaging of human subjects, we tested a model for the neural mechanisms of sensory weighting, termed "weighted connections." This model holds that the connection weights between early and late areas vary depending on the reliability of the modality, independent of the level of early sensory cortex activity. When subjects detected viewed and felt touches to the hand, a network of brain areas was active, including visual areas in lateral occipital cortex, somatosensory areas in inferior parietal lobe, and multisensory areas in the intraparietal sulcus (IPS). In agreement with the weighted connection model, the connection weight measured with structural equation modeling between somatosensory cortex and IPS increased for somatosensory-reliable stimuli, and the connection weight between visual cortex and IPS increased for visual-reliable stimuli. This double dissociation of connection strengths was similar to the pattern of behavioral responses during incongruent multisensory stimulation, suggesting that weighted connections may be a neural mechanism for behavioral reliability weighting.
Keywords: BOLD fMRI; area MT; effective connectivity; intraparietal cortex; structural equation modeling; weighted connections.
Figures
Similar articles
-
TMS of posterior parietal cortex disrupts visual tactile multisensory integration.Eur J Neurosci. 2010 May;31(10):1783-90. doi: 10.1111/j.1460-9568.2010.07193.x. Eur J Neurosci. 2010. PMID: 20584182 Free PMC article.
-
Multisensory activation of the intraparietal area when classifying grating orientation: a functional magnetic resonance imaging study.J Neurosci. 2006 Jul 12;26(28):7491-501. doi: 10.1523/JNEUROSCI.0822-06.2006. J Neurosci. 2006. PMID: 16837597 Free PMC article.
-
Combined diffusion-weighted and functional magnetic resonance imaging reveals a temporal-occipital network involved in auditory-visual object processing.Front Integr Neurosci. 2013 Feb 13;7:5. doi: 10.3389/fnint.2013.00005. eCollection 2013. Front Integr Neurosci. 2013. PMID: 23407860 Free PMC article.
-
See me, hear me, touch me: multisensory integration in lateral occipital-temporal cortex.Curr Opin Neurobiol. 2005 Apr;15(2):145-53. doi: 10.1016/j.conb.2005.03.011. Curr Opin Neurobiol. 2005. PMID: 15831395 Review.
-
Neural correlates of multisensory integration in the human brain: an ALE meta-analysis.Rev Neurosci. 2022 Sep 12;34(2):223-245. doi: 10.1515/revneuro-2022-0065. Print 2023 Feb 23. Rev Neurosci. 2022. PMID: 36084305 Review.
Cited by
-
Virtual lesion of angular gyrus disrupts the relationship between visuoproprioceptive weighting and realignment.J Cogn Neurosci. 2013 Apr;25(4):636-48. doi: 10.1162/jocn_a_00340. Epub 2012 Dec 18. J Cogn Neurosci. 2013. PMID: 23249345 Free PMC article.
-
Dynamic changes in superior temporal sulcus connectivity during perception of noisy audiovisual speech.J Neurosci. 2011 Feb 2;31(5):1704-14. doi: 10.1523/JNEUROSCI.4853-10.2011. J Neurosci. 2011. PMID: 21289179 Free PMC article.
-
Stimulus intensity modulates multisensory temporal processing.Neuropsychologia. 2016 Jul 29;88:92-100. doi: 10.1016/j.neuropsychologia.2016.02.016. Epub 2016 Feb 23. Neuropsychologia. 2016. PMID: 26920937 Free PMC article.
-
The Many Roles of Precision in Action.Entropy (Basel). 2024 Sep 14;26(9):790. doi: 10.3390/e26090790. Entropy (Basel). 2024. PMID: 39330123 Free PMC article. Review.
-
The role of explicit knowledge in compensating for a visuo-proprioceptive cue conflict.Exp Brain Res. 2024 Sep;242(9):2249-2261. doi: 10.1007/s00221-024-06898-5. Epub 2024 Jul 23. Exp Brain Res. 2024. PMID: 39042277
References
Grants and funding
LinkOut - more resources
Full Text Sources
Research Materials