Review
. 2010 Nov;9(5):526-38.
doi: 10.2174/187152710793361496.

Dopamine D1 receptors, regulation of gene expression in the brain, and neurodegeneration

Affiliations
Review

Dopamine D1 receptors, regulation of gene expression in the brain, and neurodegeneration

Jean Lud Cadet et al. CNS Neurol Disord Drug Targets. 2010 Nov.

Abstract

Dopamine (DA), the most abundant catecholamine in the basal ganglia, participates in the regulation of motor functions and of cognitive processes such as learning and memory. Abnormalities in dopaminergic systems are thought to be the bases for some neuropsychiatric disorders including addiction, Parkinson's disease, and Schizophrenia. DA exerts its arrays of functions via stimulation of D1-like (D1 and D5) and D2-like (D2, D3, and D4) DA receptors which are located in various regions of the brain. The DA D1 and D2 receptors are very abundant in the basal ganglia where they exert their functions within separate neuronal cell types. The present paper focuses on a review of the effects of stimulation of DA D1 receptors on diverse signal transduction pathways and gene expression patterns in the brain. We also discuss the possible involvement of the DA D1 receptors in DA-mediated toxic effects observed both in vitro and in vivo. Future studies using more selective agonist and antagonist agents and the use of genetically modified animals should help to further clarify the role of these receptors in the normal physiology and in pathological events that involve DA.


Figures
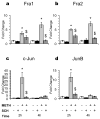
Fig. 1
Fig. 1. Quantitative PCR analyses of SCH23390-mediated inhibition of METH-induced expression of AP1 transcription factors
The levels of mRNA were measured by real-time quantitative PCR; mRNA levels were normalized to 18s RNA. Data represent means ± SEM of fold changes relative to the controls (n = 6 rats per group). Statistical significance was determined by ANOVA followed by protected least-squares difference (PLSD). $ = p <0.05, M vs. C; # = p < 0.05, M vs. M + S. Abbreviations are C, control; S, SCH23390; M, methamphetamine, and M + S, methamphetamine plus SCH23390.
Fig. 2
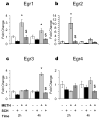
Fig. 2. Quantitative PCR analyses of the effects of METH and SCH23390 on the expression of Egr family of transcription factors
The levels of mRNA were measured by real-time quantitative PCR; mRNA levels were normalized to 18s RNA. Data represent means ± SEM of fold changes relative to the controls (n = 6 rats per group). Statistical significance was determined by ANOVA followed by protected least-squares difference (PLSD). $ = p <0.05, M vs. C; # = p < 0.05, M vs. M + S. Abbreviations are C, control; S, SCH23390; M, methamphetamine, and M + S, methamphetamine plus SCH23390.
Fig. 3
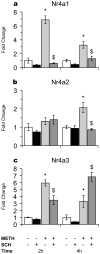
Fig. 3. Quantitative PCR analyses of the effects of METH and SCH23390 on the expression of Nr4a family of transcription factors
The levels of mRNA were measured by real-time quantitative PCR; mRNA levels were normalized to 18s RNA. Data represent means ± SEM of fold changes relative to the controls (n = 6 rats per group). Statistical significance was determined by ANOVA followed by protected least-squares difference (PLSD). $ = p <0.05, M vs. C; # = p < 0.05, M vs. M + S. Abbreviations are C, control; S, SCH23390; M, methamphetamine, and M + S, methamphetamine plus SCH23390.
Fig. 4
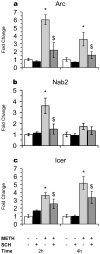
Fig. 4. Quantitative PCR analyses of the effects of METH and SCH23390 on the expression of Arc, Icer, and Nab2
The levels of mRNA were measured by real-time quantitative PCR; mRNA levels were normalized to 18s RNA. Data represent means ± SEM of fold changes relative to the controls (n = 6 rats per group). Statistical significance was determined by ANOVA followed by protected least-squares difference (PLSD). $ = p <0.05, M vs. C; # = p < 0.05, M vs. M + S. Abbreviations are C, control; S, SCH23390; M, methamphetamine, and M + S, methamphetamine plus SCH23390.

Similar articles

Cited by

References

    1. Harley CW. Norepinephrine and dopamine as learning signals. Neural Plast. 2004;11:191–204. - PMC - PubMed
    1. Fallon JH. Topographic organization of ascending dopaminergic projections. Ann N Y Acad Sci. 1988;537:1–9. - PubMed
    1. Jimenez-Castellanos J, Graybiel AM. Subdivisions of the dopamine-containing A8-A9-A10 complex identified by their differential mesostriatal innervation of striosomes and extrastriosomal matrix. Neuroscience. 1987;23:223–242. - PubMed
    1. Bjorklund A, Dunnett SB. Dopamine neuron systems in the brain: an update. Trends Neurosci. 2007;30:194–202. - PubMed
    1. Chinta SJ, Andersen JK. Dopaminergic neurons. Int J Biochem Cell Biol. 2005;37:942–946. - PubMed

MeSH terms

LinkOut - more resources