

LocusZoom: regional visualization of genome-wide association scan results
- PMID: 20634204
- PMCID: PMC2935401
- DOI: 10.1093/bioinformatics/btq419
LocusZoom: regional visualization of genome-wide association scan results
Abstract
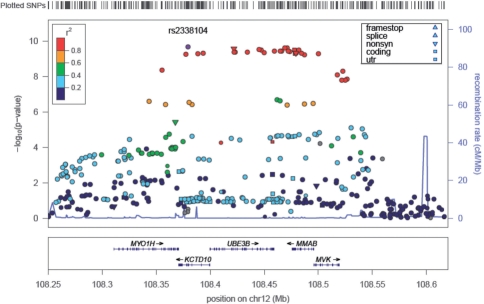
Genome-wide association studies (GWAS) have revealed hundreds of loci associated with common human genetic diseases and traits. We have developed a web-based plotting tool that provides fast visual display of GWAS results in a publication-ready format. LocusZoom visually displays regional information such as the strength and extent of the association signal relative to genomic position, local linkage disequilibrium (LD) and recombination patterns and the positions of genes in the region.
Availability: LocusZoom can be accessed from a web interface at http://csg.sph.umich.edu/locuszoom. Users may generate a single plot using a web form, or many plots using batch mode. The software utilizes LD information from HapMap Phase II (CEU, YRI and JPT+CHB) or 1000 Genomes (CEU) and gene information from the UCSC browser, and will accept SNP identifiers in dbSNP or 1000 Genomes format. Single plots are generated in approximately 20 s. Source code and associated databases are available for download and local installation, and full documentation is available online.
Figures
References
Publication types
MeSH terms
Grants and funding
- K99HL094535/HL/NHLBI NIH HHS/United States
- R01 HG002651/HG/NHGRI NIH HHS/United States
- U01 HG005214/HG/NHGRI NIH HHS/United States
- R01 HG000376/HG/NHGRI NIH HHS/United States
- T32 HG000040/HG/NHGRI NIH HHS/United States
- HG002651/HG/NHGRI NIH HHS/United States
- R56 HG000376/HG/NHGRI NIH HHS/United States
- U01 DK062370/DK/NIDDK NIH HHS/United States
- HG000376/HG/NHGRI NIH HHS/United States
- Z01 HG000040/ImNIH/Intramural NIH HHS/United States
- MH084698/MH/NIMH NIH HHS/United States
- R56 DK062370/DK/NIDDK NIH HHS/United States
- R01 MH084698/MH/NIMH NIH HHS/United States
- R01 DK062370/DK/NIDDK NIH HHS/United States
- K99 HL094535/HL/NHLBI NIH HHS/United States
- HG000040/HG/NHGRI NIH HHS/United States
- DK062370/DK/NIDDK NIH HHS/United States
- HG005214/HG/NHGRI NIH HHS/United States
LinkOut - more resources
Full Text Sources
Other Literature Sources
Research Materials
