. 2010 Nov 4;116(18):3456-64.
doi: 10.1182/blood-2009-10-249177. Epub 2010 Jul 15.

Cellular source and molecular form of TNF specify its distinct functions in organization of secondary lymphoid organs

Affiliations

Cellular source and molecular form of TNF specify its distinct functions in organization of secondary lymphoid organs

Alexei V Tumanov et al. Blood. .

Abstract

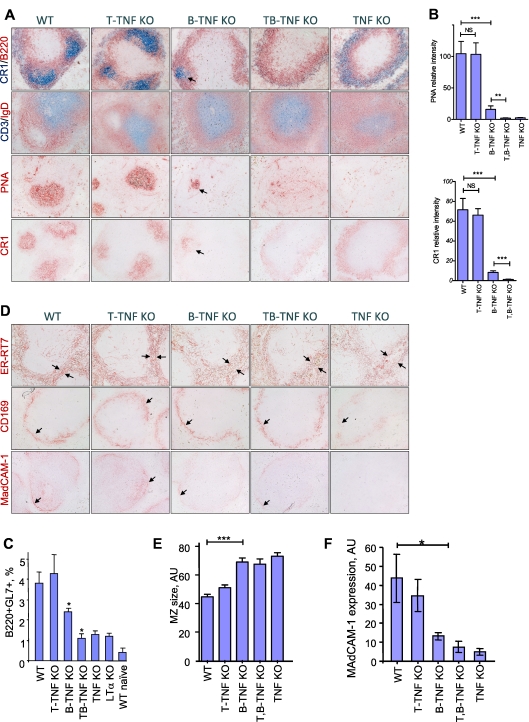
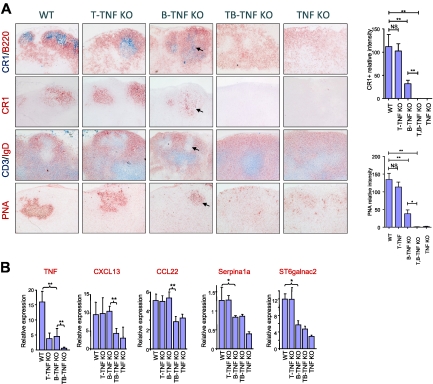
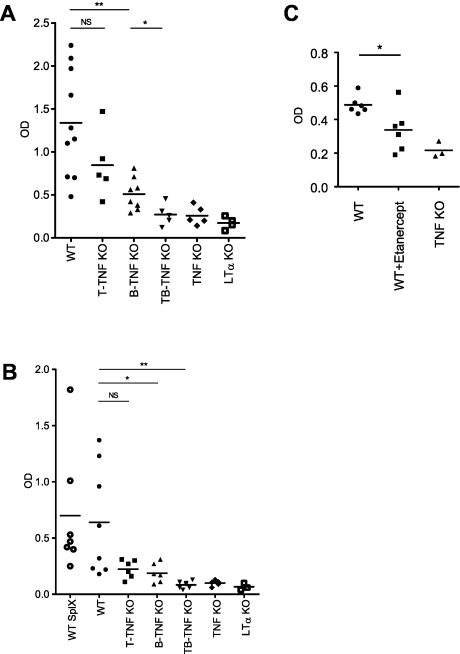
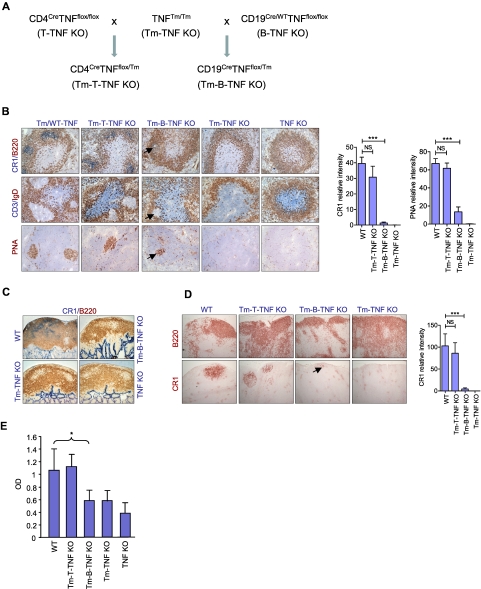
Secondary lymphoid organs provide a unique microenvironment for generation of immune responses. Using a cell type-specific conditional knockout approach, we have dissected contributions of tumor necrosis factor (TNF) produced by B cells (B-TNF) or T cells (T-TNF) to the genesis and homeostatic organization of secondary lymphoid organs. In spleen, lymph nodes and Peyer patches, the cellular source of TNF, and its molecular form (soluble versus membrane-bound) appeared distinct. In spleen, in addition to major B-TNF signal, a complementary T-TNF signal contributed to the microstructure. In contrast, B-TNF predominantly controlled the development of follicular dendritic cells and B-cell follicles in Peyer patches. In lymph nodes, cooperation between TNF expressed by B and T cells was necessary for the maintenance of microarchitecture and for generation of an efficient humoral immune response. Unexpectedly, soluble but not membrane TNF expressed by B cells was essential for the organization of the secondary lymphoid organs. Thus, the maintenance of each type of secondary lymphoid organ is orchestrated by distinct contributions of membrane-bound and soluble TNF produced by B and T lymphocytes.


Figures

Figure 1
Figure 1
Maintenance of spleen microarchitecture is primarily dependent on TNF expressed by B cells with distinct contribution of T-cell–derived TNF. (A) Mice were immunized with i.p. SRBCs and spleen sections analyzed on day 8. B-TNF KO mice display reduced GCs, lack of polarized B-cell follicles, and disruption of FDC networks. Note that some FDC- and PNA-positive cells are present in the spleens of B-TNF KO mice (shown by arrows), while no FDCs and no polarized B-cell follicles are observed in spleen of T,B-TNF KO mice. Original magnification is ×200. Representative images from 1 of 3 independent experiments (n = 5 mice per group) are shown. (B) Quantification of GC and FDC areas from panel A. Data represent means ± SEM; *P < .05, **P < .01, ***P < .001. (C) Analysis of germinal center B cells. Mice were immunized with i.p. SRBCs, and GL7+ GC B cells were analyzed by flow cytometry on day 8 (represents 1 of 2 independent experiments, 3 mice per group). Data represent means ± SD; *P < .05. (D) MZ structure is dependent on TNF produced by B, T, and other cell types. Mice were immunized with i.p. SRBCs, and spleen sections were analyzed on day 8. Frozen spleen sections were labeled with anti-ER-TR7, anti-CD169, and anti-MAdCAM-1 antibodies. Note the increased breadth of the MZ (ER-TR7 labeling), reduced and disorganized MAdCAM-1, and CD169 staining in B-TNF, T,B-TNF, and TNF KO mice (marked by black arrows). Microphotographs were taken with an Olympus BX41 microscope with a Zeiss Axiocam digital camera; images were captured with Zeiss Imaging AxioVision (Version 4.7) and processed using Adobe Photoshop CS3 (Version 10.0). Original magnification is ×200. Representative images from 1 of 3 independent experiments (n = 5 mice per group) are shown. (E) Quantification of MZ size on panel D (ER-TR7 labeling). MZ size (shown by arrows) was quantified using NIH ImageJ software. Data represent means ± SEM. (F) Expression of MAdCAM-1 in spleens of indicated mutant mice measured by real-time PCR. Data represent means ± SD; n = 3, *P < .05.
Figure 2
Figure 2
Role of TNF produced by lymphocytes in supporting organization of LNs. (A) B and T cells cooperate by TNF production in generation of FDCs in LNs. Mice were immunized i.p. with 108 SRBCs and analyzed on day 8. Frozen sections of MLNs were stained with indicated antibodies. Magnification is ×200. Note the reduction of FDCs and GCs in both B-TNF KO mice (shown by arrows) and the complete absence of FDCs and GCs in T,B-TNF and TNF KO mice. Representative images from 1 of 3 independent experiments (n = 5 mice per group) are shown. Right panel shows quantification of CR1- and PNA-positive areas. Data represent means ± SEM; *P < .05, **P < .01. (B) TNF from B and T cells acts in concert in regulating TNF-dependent genes in LNs. Analysis of TNF and TNF-dependent gene expression in MLNs of indicated mutant mice (represents 1 of 2 independent experiments, n = 3 mice per group, means ± SD); *P < .05, **P < .01.
Figure 3
Figure 3
Inactivation of TNF production by both B and T cells results in impaired humoral response to T-cell–dependent antigen. (A) Mice were immunized i.p. with 108 SRBCs. Sera were collected on day 21, and anti-SRBC response was measured by ELISA. Symbols indicate individual mice. Mean values are indicated. IgG response is reduced both in B-TNF and T-TNF KO mice, however not as severe as in T,B-TNF and TNF KO mice. Symbols indicate individual mice. One of 3 experiments with similar results is shown (n = 5-8 mice per group). (B) Mice were immunized i.f.p. with 108 SRBCs and anti-SRBC IgG titers were analyzed on day 21. SplX-WT mice were splenectomized 10 days before immunization. LTα KO mice are included as control. Average is indicated. Symbols indicate individual mice. One of 2 independent experiments with similar results is shown (n = 5-8 mice per group); *P < .05, **P < .01, NS, not significant. (C) Administration of TNF blocker inhibits humoral immune response to T-cell–dependent antigen. Mice were immunized i.p. with 108 SRBCs and specific anti-IgG response was measured at day 21. Etanercept (30 mg/kg) was injected twice per week starting from day −6. One of 2 independent experiments with similar results is shown. Each symbol represent individual mouse. Average is indicated; *P < .05.
Figure 4
Figure 4
Soluble TNF produced by B cells is essential for organization of secondary lymphoid organs and for efficient humoral immune responses. (A) A breeding strategy to generate mice expressing only membrane form of TNF specifically in B or T cells (Tm-B-TNF KO and Tm-T-TNF KO mice). (B-E) Mice were immunized i.p. with 108 SRBCs, and frozen section analyzed on day 8. Representative images from 1 of 2 independent experiments (n = 5 mice per group) are shown. (B) Frozen spleen sections were stained with antibodies anti-B220 (red)/anti-CR1 (blue), PNA (red), anti-CD3(blue)/IgD (red). Arrows indicate residual FDCs and GCs in spleen of Tm-B-TNF KO mice. Original magnification is ×200. Right panels show quantification of FDC and GC areas. Data represent means ± SEM. (C) Frozen sections of PP were stained with anti-CR1 (blue)/anti-B220 (red) antibodies. Original magnification is ×100. (D) Frozen sections of MLNs were stained with anti-B220 and anti-CR1 antibody to visualize B-cell follicles and FDCs, respectively. Arrow indicates residual FDCs staining in MLNs of Tm-B-TNF KO mice. Original magnification is ×100. Right panel shows quantification of FDC areas. Data represent means ± SEM. (E) Soluble TNF from B cells is required for generation of IgG response to T-cell–dependent antigen. Mice were immunized i.f.p. with 108 SRBCs and specific IgG response was measured on day 21. One of 2 independent experiments with similar results is shown. Data represent means ± SD; n = 5 mice per group, *P < .05, **P < .01, ***P < .001.

References

    1. Fu YX, Chaplin DD. Development and maturation of secondary lymphoid tissues. Annu Rev Immunol. 1999;17:399–433. - PubMed
    1. Mebius RE. Organogenesis of lymphoid tissues. Nat Rev Immunol. 2003;3(4):292–303. - PubMed
    1. Allen CD, Okada T, Tang HL, Cyster JG. Imaging of germinal center selection events during affinity maturation. Science. 2007;315(5811):528–531. - PubMed
    1. Tumanov AV, Grivennikov SI, Shakhov AN, et al. Dissecting the role of lymphotoxin in lymphoid organs by conditional targeting. Immunol Rev. 2003;195:106–116. - PubMed
    1. Ware CF. Network communications: lymphotoxins, LIGHT, and TNF. Annu Rev Immunol. 2005;23:787–819. - PubMed

Publication types

Substances