Familial Alzheimer's disease mutations in presenilins: effects on endoplasmic reticulum calcium homeostasis and correlation with clinical phenotypes
- PMID: 20634584
- PMCID: PMC4996666
- DOI: 10.3233/JAD-2010-100159
Familial Alzheimer's disease mutations in presenilins: effects on endoplasmic reticulum calcium homeostasis and correlation with clinical phenotypes
Abstract
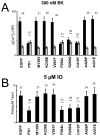
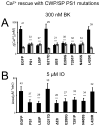
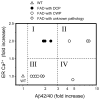
Mutations in presenilins 1 and 2 (PS1 and PS2) are responsible for approximately 40% of all early onset familial Alzheimer's disease (FAD) monogenic cases. Presenilins (PSs) function as the catalytic subunit of γ-secretase and support cleavage of the amyloid-β protein precursor (AβPP). We previously discovered that PSs also function as passive endoplasmic reticulum (ER) calcium (Ca2+) leak channels and that most FAD mutations in PSs affected their ER Ca2+ leak function. To further validate the relevance of our findings to human disease, we here performed Ca2+ imaging experiments with lymphoblasts established from FAD patients. We discovered that most FAD mutations in PSs disrupted ER Ca2+ leak function and resulted in increased ER Ca2+ pool in human lymphoblasts. However, we found that a subset of PS1 FAD mutants supported ER Ca2+ leak activity, as ER Ca2+ pool was unaffected in lymphoblasts. Most of the "functional" mutations for ER Ca2+ leak were clustered in the exon 8-9 area of PSEN1 gene and segregated with the cotton wool plaques and spastic paraparesis clinical phenotype occasionally observed in PS1 FAD patients. Our findings with the "functional" and "non-functional" PS1 FAD mutants were confirmed in Ca2+ rescue experiments with PS double-knockout mouse embryonic fibroblasts. Based on the combined effects of the PS1 FAD mutations on ER Ca2+ leak and γ-secretase activities we propose a model that explains the heterogeneity observed in FAD. The proposed model has implications for understanding the pathogenesis of both familial and sporadic AD.
Figures


Similar articles
-
Familial Alzheimer disease-linked mutations specifically disrupt Ca2+ leak function of presenilin 1.J Clin Invest. 2007 May;117(5):1230-9. doi: 10.1172/JCI30447. Epub 2007 Apr 12. J Clin Invest. 2007. PMID: 17431506 Free PMC article.
-
Presenilins form ER Ca2+ leak channels, a function disrupted by familial Alzheimer's disease-linked mutations.Cell. 2006 Sep 8;126(5):981-93. doi: 10.1016/j.cell.2006.06.059. Cell. 2006. PMID: 16959576 Free PMC article.
-
Presenilins and calcium signaling-systems biology to the rescue.Sci Signal. 2013 Jul 9;6(283):pe24. doi: 10.1126/scisignal.2004296. Sci Signal. 2013. PMID: 23838181 Free PMC article. Review.
-
Presenilins as endoplasmic reticulum calcium leak channels and Alzheimer's disease pathogenesis.Sci China Life Sci. 2011 Aug;54(8):744-51. doi: 10.1007/s11427-011-4201-y. Epub 2011 Jul 24. Sci China Life Sci. 2011. PMID: 21786197 Review.
-
Familial Alzheimer's disease-associated presenilin 1 mutants promote γ-secretase cleavage of STIM1 to impair store-operated Ca2+ entry.Sci Signal. 2016 Sep 6;9(444):ra89. doi: 10.1126/scisignal.aaf1371. Sci Signal. 2016. PMID: 27601731 Free PMC article.
Cited by
-
Familial Alzheimer's disease-associated presenilin-1 alters cerebellar activity and calcium homeostasis.J Clin Invest. 2014 Apr;124(4):1552-67. doi: 10.1172/JCI66407. Epub 2014 Feb 24. J Clin Invest. 2014. PMID: 24569455 Free PMC article.
-
Biochemical Markers in Alzheimer's Disease.Int J Mol Sci. 2020 Mar 14;21(6):1989. doi: 10.3390/ijms21061989. Int J Mol Sci. 2020. PMID: 32183332 Free PMC article. Review.
-
Dysregulation of Intracellular Calcium Signaling in Alzheimer's Disease.Antioxid Redox Signal. 2018 Oct 20;29(12):1176-1188. doi: 10.1089/ars.2018.7506. Epub 2018 Aug 3. Antioxid Redox Signal. 2018. PMID: 29890840 Free PMC article. Review.
-
Presenilin adopts the ClC channel fold.Protein Sci. 2016 Jul;25(7):1363-5. doi: 10.1002/pro.2919. Epub 2016 Mar 23. Protein Sci. 2016. PMID: 26971579 Free PMC article.
-
Reduced presynaptic vesicle stores mediate cellular and network plasticity defects in an early-stage mouse model of Alzheimer's disease.Mol Neurodegener. 2019 Jan 22;14(1):7. doi: 10.1186/s13024-019-0307-7. Mol Neurodegener. 2019. PMID: 30670054 Free PMC article.
References
-
- Hardy J. The amyloid hypothesis for Alzheimer’s disease: a critical reappraisal. J Neurochem. 2009;110:1129–1134. - PubMed
-
- Hardy J, Selkoe DJ. The amyloid hypothesis of Alzheimer’s disease: progress and problems on the road to therapeutics. Science. 2002;297:353–356. - PubMed
-
- Bertram L, Tanzi RE. Thirty years of Alzheimer’s disease genetics: the implications of systematic meta-analyses. Nat Rev Neurosci. 2008;9:768–778. - PubMed
-
- Bergmans BA, De Strooper B. gamma-secretases: from cell biology to therapeutic strategies. Lancet Neurol. 2010;9:215–226. - PubMed
Publication types
MeSH terms
Substances
Grants and funding
LinkOut - more resources
Full Text Sources
Other Literature Sources
Medical
Miscellaneous

