

Comparison of HIV-1 genotypic resistance test interpretation systems in predicting virological outcomes over time
- PMID: 20634893
- PMCID: PMC2901338
- DOI: 10.1371/journal.pone.0011505
Comparison of HIV-1 genotypic resistance test interpretation systems in predicting virological outcomes over time
Abstract
Background: Several decision support systems have been developed to interpret HIV-1 drug resistance genotyping results. This study compares the ability of the most commonly used systems (ANRS, Rega, and Stanford's HIVdb) to predict virological outcome at 12, 24, and 48 weeks.
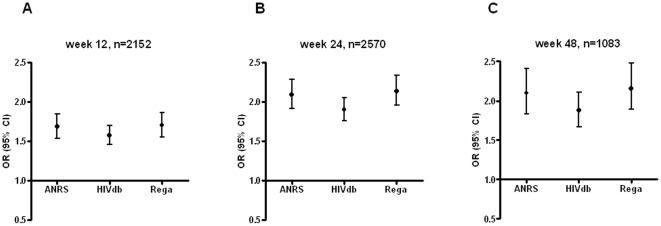
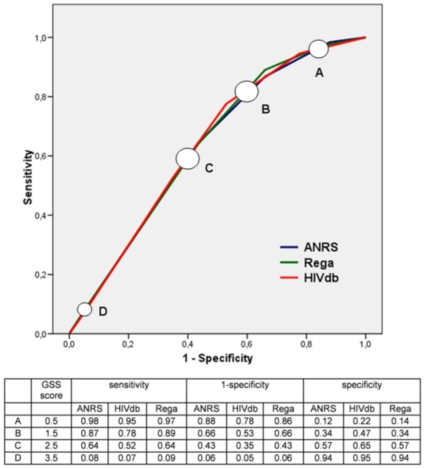
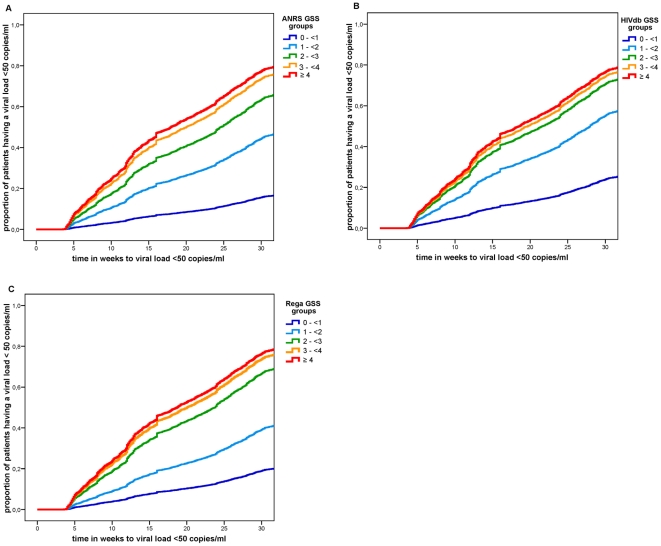
Methodology/principal findings: Included were 3763 treatment-change episodes (TCEs) for which a HIV-1 genotype was available at the time of changing treatment with at least one follow-up viral load measurement. Genotypic susceptibility scores for the active regimens were calculated using scores defined by each interpretation system. Using logistic regression, we determined the association between the genotypic susceptibility score and proportion of TCEs having an undetectable viral load (<50 copies/ml) at 12 (8-16) weeks (2152 TCEs), 24 (16-32) weeks (2570 TCEs), and 48 (44-52) weeks (1083 TCEs). The Area under the ROC curve was calculated using a 10-fold cross-validation to compare the different interpretation systems regarding the sensitivity and specificity for predicting undetectable viral load. The mean genotypic susceptibility score of the systems was slightly smaller for HIVdb, with 1.92+/-1.17, compared to Rega and ANRS, with 2.22+/-1.09 and 2.23+/-1.05, respectively. However, similar odds ratio's were found for the association between each-unit increase in genotypic susceptibility score and undetectable viral load at week 12; 1.6 [95% confidence interval 1.5-1.7] for HIVdb, 1.7 [1.5-1.8] for ANRS, and 1.7 [1.9-1.6] for Rega. Odds ratio's increased over time, but remained comparable (odds ratio's ranging between 1.9-2.1 at 24 weeks and 1.9-2.2 at 48 weeks). The Area under the curve of the ROC did not differ between the systems at all time points; p = 0.60 at week 12, p = 0.71 at week 24, and p = 0.97 at week 48.
Conclusions/significance: Three commonly used HIV drug resistance interpretation systems ANRS, Rega and HIVdb predict virological response at 12, 24, and 48 weeks, after change of treatment to the same extent.
Conflict of interest statement
Figures
References
-
- Lorenzi P, Opravil M, Hirschel B, Chave JP, Furrer HJ, et al. Impact of drug resistance mutations on virologic response to salvage therapy. Swiss HIV Cohort Study. AIDS. 1999;13:F17–F21. - PubMed
-
- Durant J, Clevenbergh P, Halfon P, Delgiudice P, Porsin S, et al. Drug-resistance genotyping in HIV-1 therapy: the VIRADAPT randomised controlled trial. Lancet. 1999;353:2195–2199. - PubMed
-
- Cingolani A, Antinori A, Rizzo MG, Murri R, Ammassari A, et al. Usefulness of monitoring HIV drug resistance and adherence in individuals failing highly active antiretroviral therapy: a randomized study (ARGENTA). Aids. 2002;16:369–379. - PubMed
-
- Tural C, Ruiz L, Holtzer C, Schapiro J, Viciana P, et al. Clinical utility of HIV-1 genotyping and expert advice: the Havana trial. Aids. 2002;16:209–218. - PubMed
-
- Meynard JL, Vray M, Morand-Joubert L, Race E, Descamps D, et al. Phenotypic or genotypic resistance testing for choosing antiretroviral therapy after treatment failure: a randomized trial. Aids. 2002;16:727–736. - PubMed
Publication types
MeSH terms
Substances
LinkOut - more resources
Full Text Sources
Medical
