

ESTIMATING MARGINAL RETURNS TO MEDICAL CARE: EVIDENCE FROM AT-RISK NEWBORNS
- PMID: 20634927
- PMCID: PMC2903901
- DOI: 10.1162/qjec.2010.125.2.591
ESTIMATING MARGINAL RETURNS TO MEDICAL CARE: EVIDENCE FROM AT-RISK NEWBORNS
Abstract
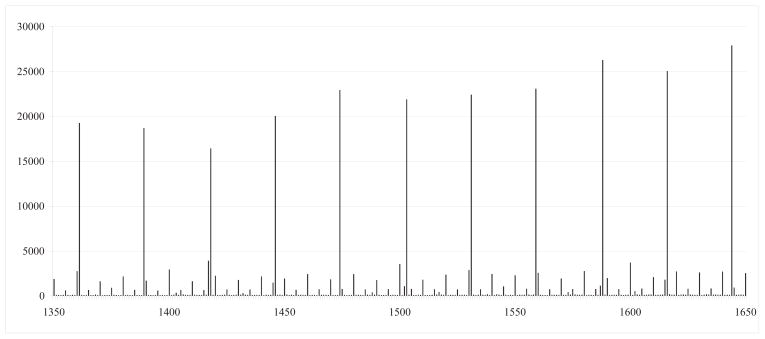
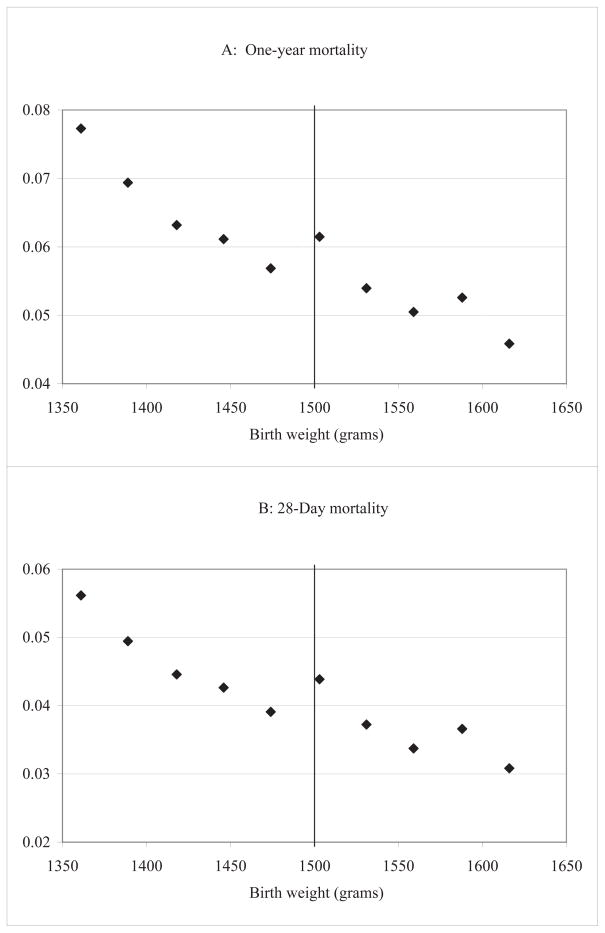
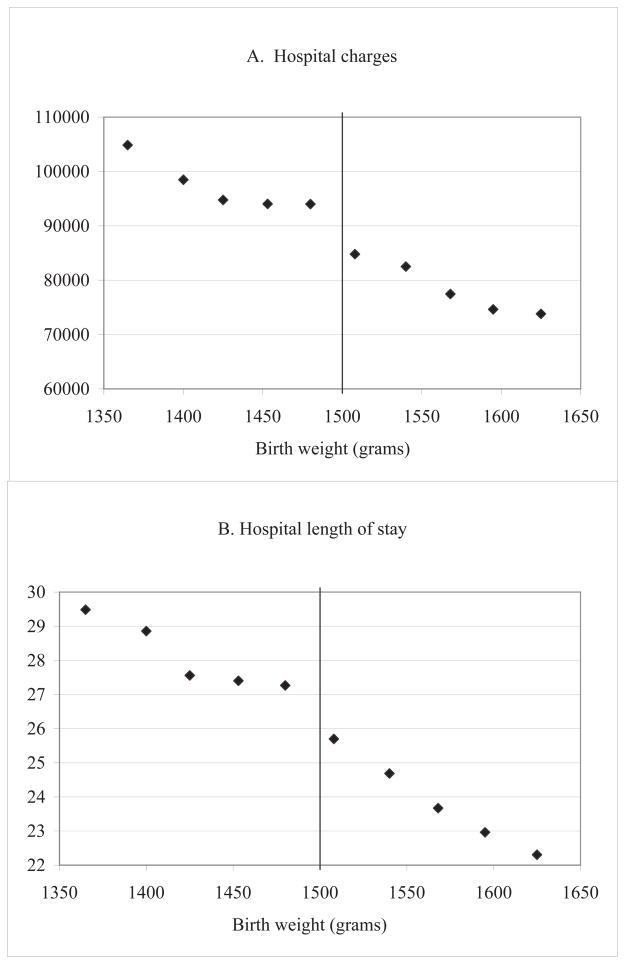
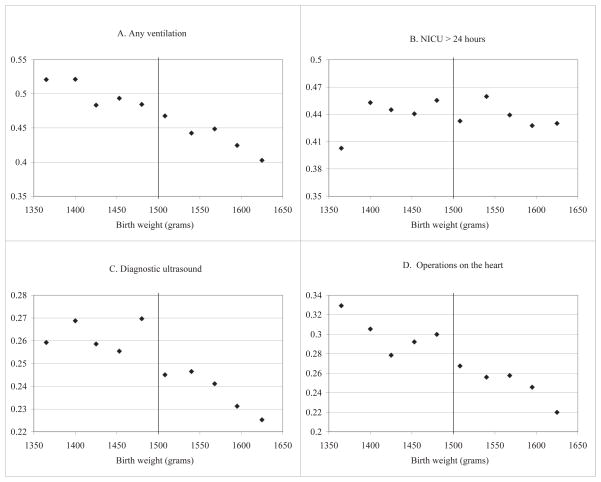
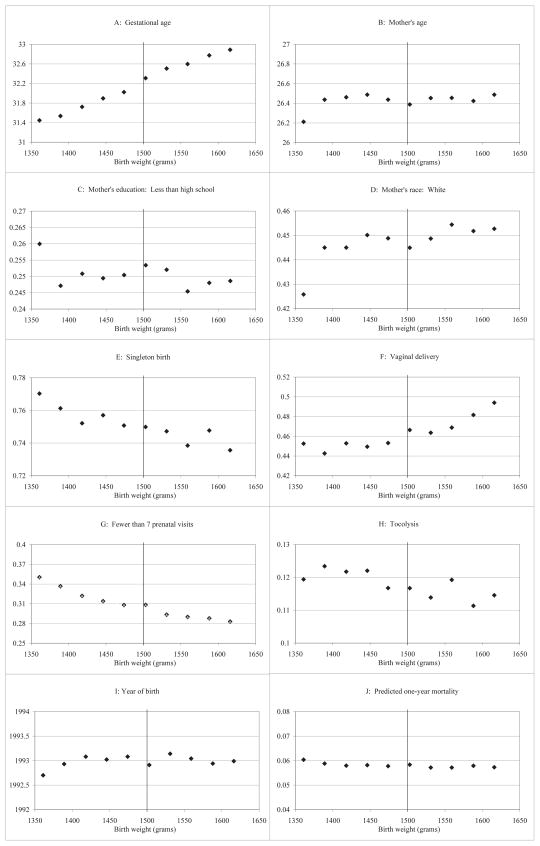
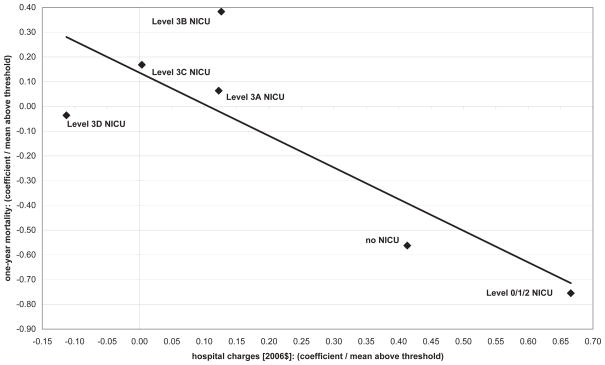
A key policy question is whether the benefits of additional medical expenditures exceed their costs. We propose a new approach for estimating marginal returns to medical spending based on variation in medical inputs generated by diagnostic thresholds. Specifically, we combine regression discontinuity estimates that compare health outcomes and medical treatment provision for newborns on either side of the very low birth weight threshold at 1500 grams. First, using data on the census of US births in available years from 1983-2002, we find that newborns with birth weights just below 1500 grams have lower one-year mortality rates than do newborns with birth weights just above this cutoff, even though mortality risk tends to decrease with birth weight. One-year mortality falls by approximately one percentage point as birth weight crosses 1500 grams from above, which is large relative to mean infant mortality of 5.5% just above 1500 grams. Second, using hospital discharge records for births in five states in available years from 1991-2006, we find that newborns with birth weights just below 1500 grams have discontinuously higher charges and frequencies of specific medical inputs. Hospital costs increase by approximately $4,000 as birth weight crosses 1500 grams from above, relative to mean hospital costs of $40,000 just above 1500 grams. Under an assumption that observed medical spending fully captures the impact of the "very low birth weight" designation on mortality, our estimates suggest that the cost of saving a statistical life of a newborn with birth weight near 1500 grams is on the order of $550,000 in 2006 dollars.
Figures
References
-
- Almond Douglas, Doyle Joseph. National Bureau of Economic Research (NBER) working paper 13877. 2008. After midnight: A regression discontinuity design in length of postpartum hospital stays.
-
- Andre Malin, Borgquist Lars, Foldevi Mats, Molstad Sigvard. Asking for ‘rules of thumb’: a way to discover tacit knowledge in medical practice. Family Medicine. 2002;19:617–622. - PubMed
-
- Angert Robert, Adam Henry. Care of the very low-birthweight infant. Pediatrics Review. 2009;30:1–32. - PubMed
-
- Anspach Renee. Deciding Who Lives: Fateful Choices in the Intensive-Care Nursury. University of California Press; 1993.
-
- Babson S Gorham, Benda Gerda. Growth graphs for the clinical assessment of infants of varying gestational age. Journal of Pediatrics. 1976;89:814–820. - PubMed
Grants and funding
LinkOut - more resources
Full Text Sources