

Utility of double-contrast multi-detector CT scans to assess cartilage thickness after tibial plafond fracture
- PMID: 20634971
- PMCID: PMC2903754
- DOI: 10.2147/orr.s7387
Utility of double-contrast multi-detector CT scans to assess cartilage thickness after tibial plafond fracture
Abstract
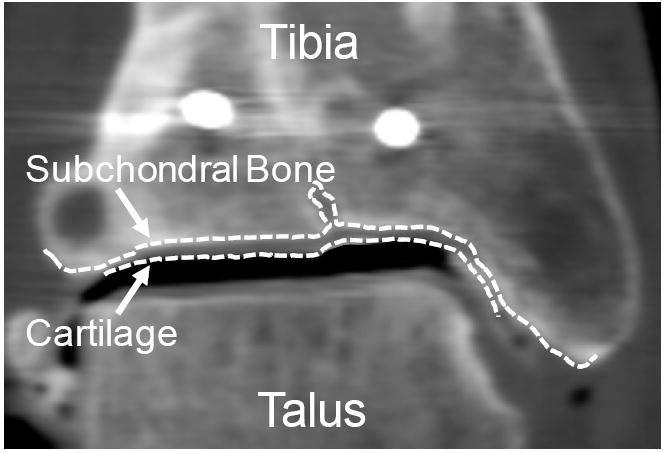
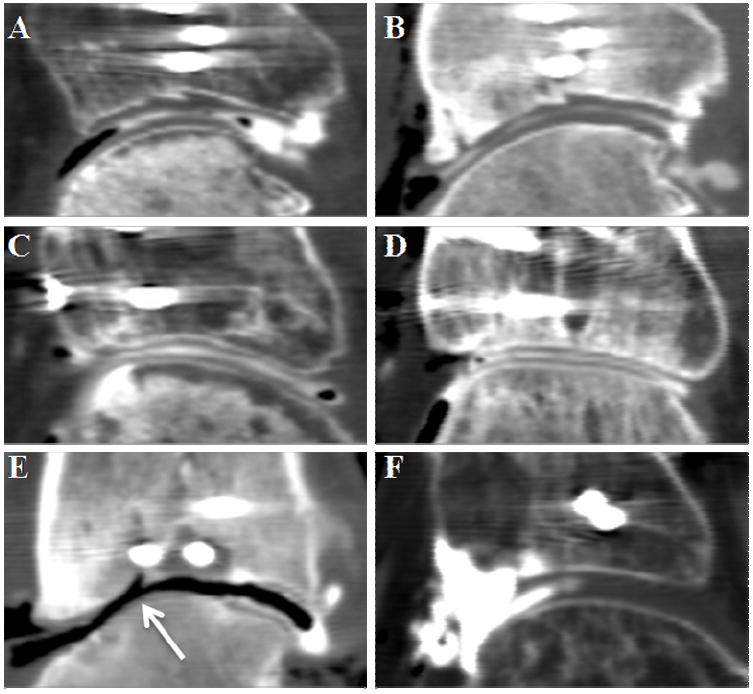
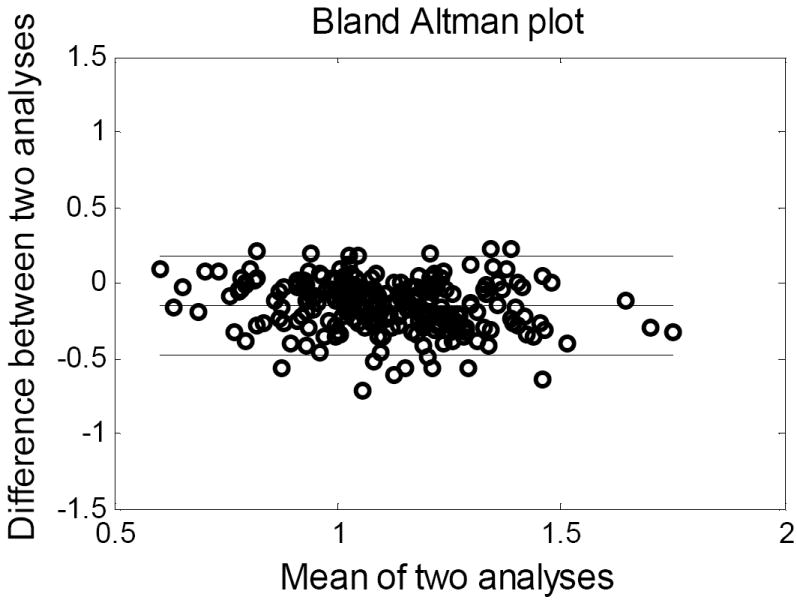
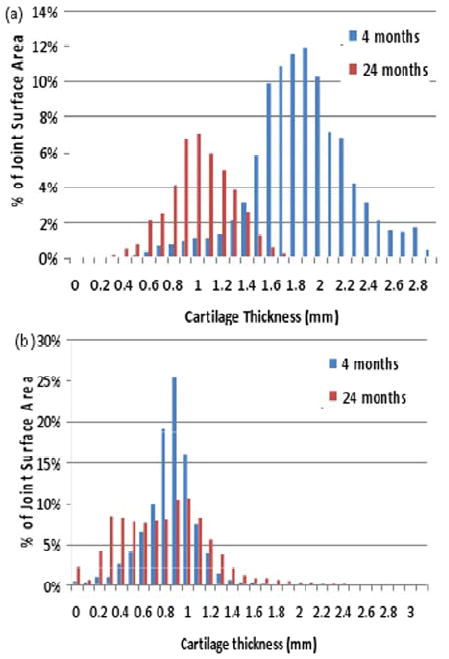
The pathophysiology of post-traumatic osteoarthritis (PTOA) after intra-articular fractures is poorly understood. Pursuit of a better understanding of this disease is complicated by inability to accurately monitor its onset, progression and severity. Common radiographic methods used to assess PTOA do not provide sufficient image quality for precise cartilage measurements. Double-contrast MDCT is an alternative method that may be useful, since it produces high-quality images in normal ankles. The purpose of this study was to assess this technique's performance in assessing cartilage maintenance in ankles with an intra-articular fracture. Thirty-six tibial plafond fractures were followed over two years, with thirty-one MDCTs being obtained four months after injury, and twenty-two MDCTs after two years. Unfortunately, clinical results with this technique were unreliable due to pathology (presumed arthrofibrosis) and technical problems (pooling of contrast). The arthrofibrosis that developed in many patients inhibited proper joint access and contrast infiltration, although high-quality images were obtained in eleven patients. In this patient subset, in which focal regions of cartilage degeneration could be visualized, thickness could be measured with a high degree of fidelity. While thus useful in selected instances, double-contrast MDCT was too unreliable to be recommended to assess these particular types of injuries.
Figures
References
-
- Martin J, Marsh JL, Nepola JV, Dirschl DR, Hurwitz S, DeCoster TA. Radiographic fracture assessments: which ones can we reliably make? J Orthop Trauma. 2000 Aug;14(6):379–385. - PubMed
-
- Chan WP, Lang P, Stevens MP, et al. Osteoarthritis of the knee: comparison of radiography, CT, and MR imaging to assess extent and severity. AJR Am J Roentgenol. 1991 Oct;157(4):799–806. - PubMed
-
- El-Khoury GY, Alliman KJ, Lundberg HJ, Rudert MJ, Brown TD, Saltzman CL. Cartilage thickness in cadaveric ankles: measurement with double-contrast multi-detector row CT arthrography versus MR imaging. Radiology. 2004 Dec;233(3):768–773. - PubMed
Grants and funding
LinkOut - more resources
Full Text Sources