. 2010 May;3(5):459-469.
doi: 10.4236/jbise.2010.35064.

An Analysis of Quantitative PCR Reliability Through Replicates Using the C Method

Affiliations

An Analysis of Quantitative PCR Reliability Through Replicates Using the C Method

Chris C Stowers et al. J Biomed Sci Eng. 2010 May.

Abstract

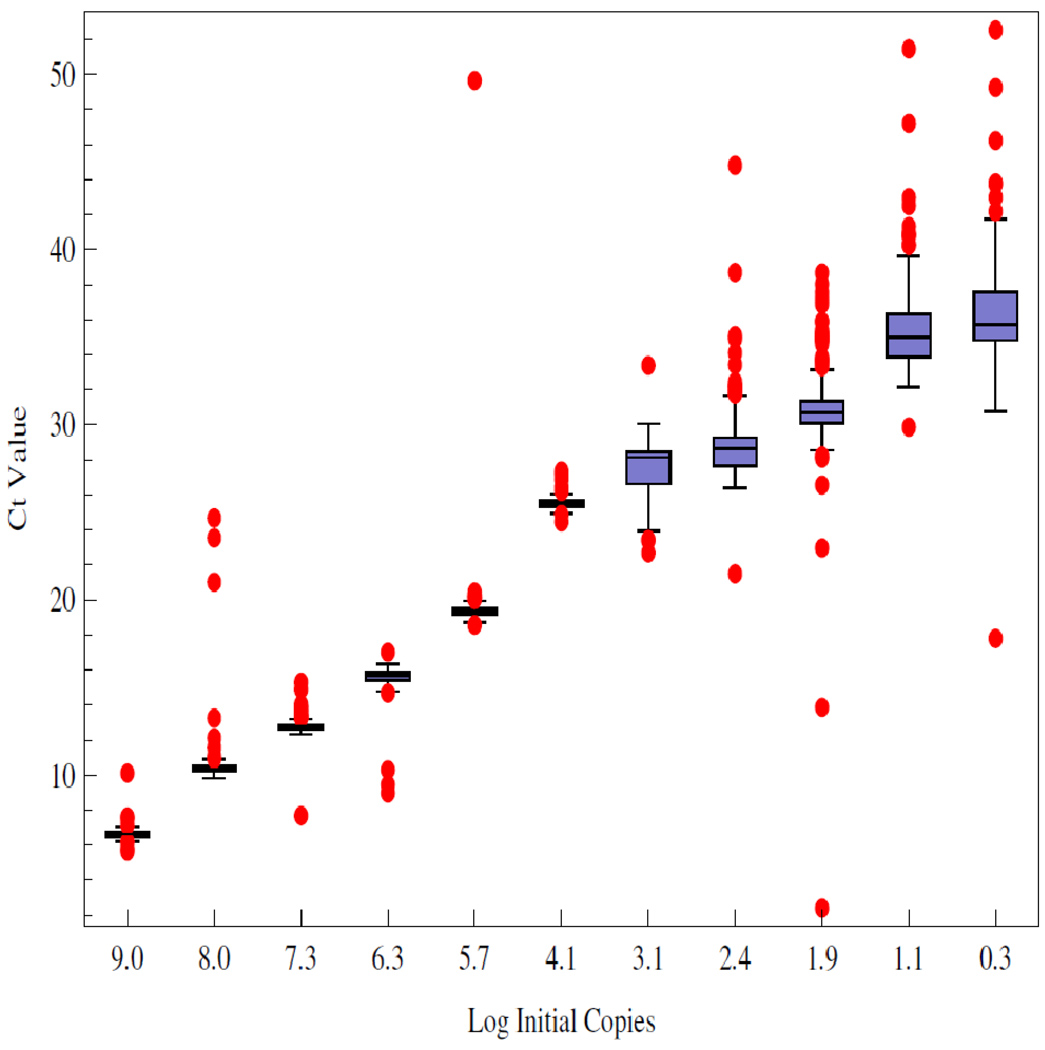
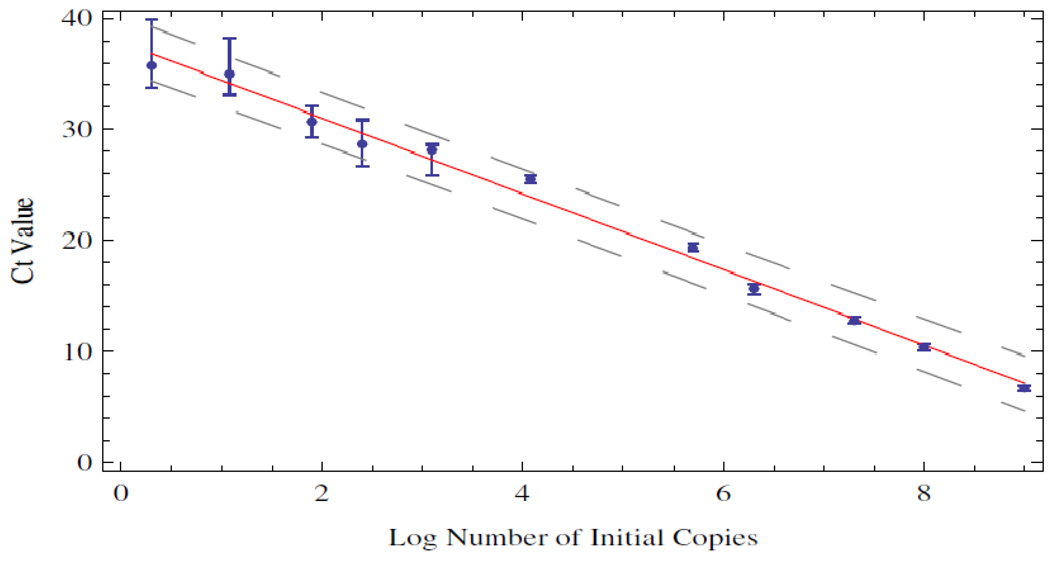
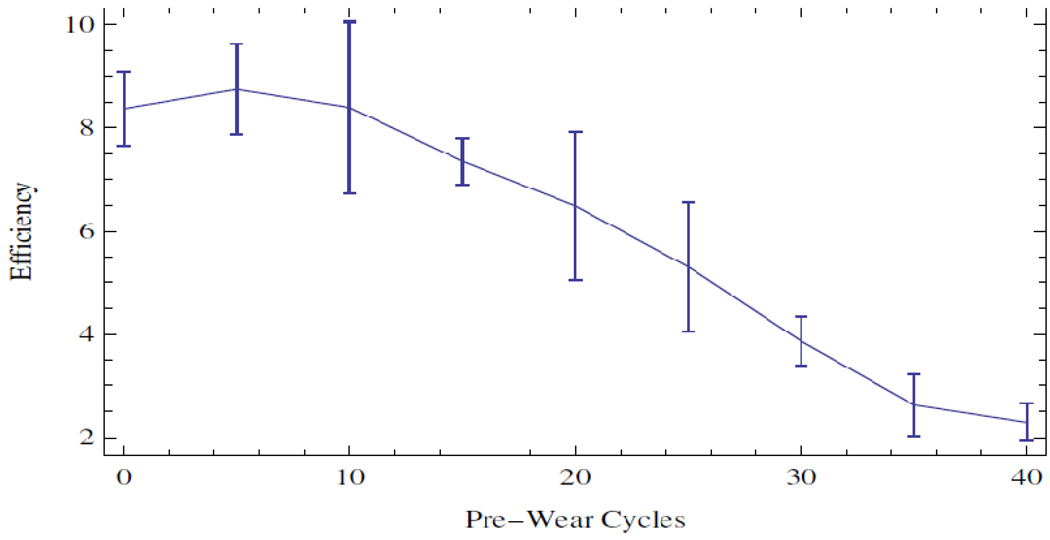
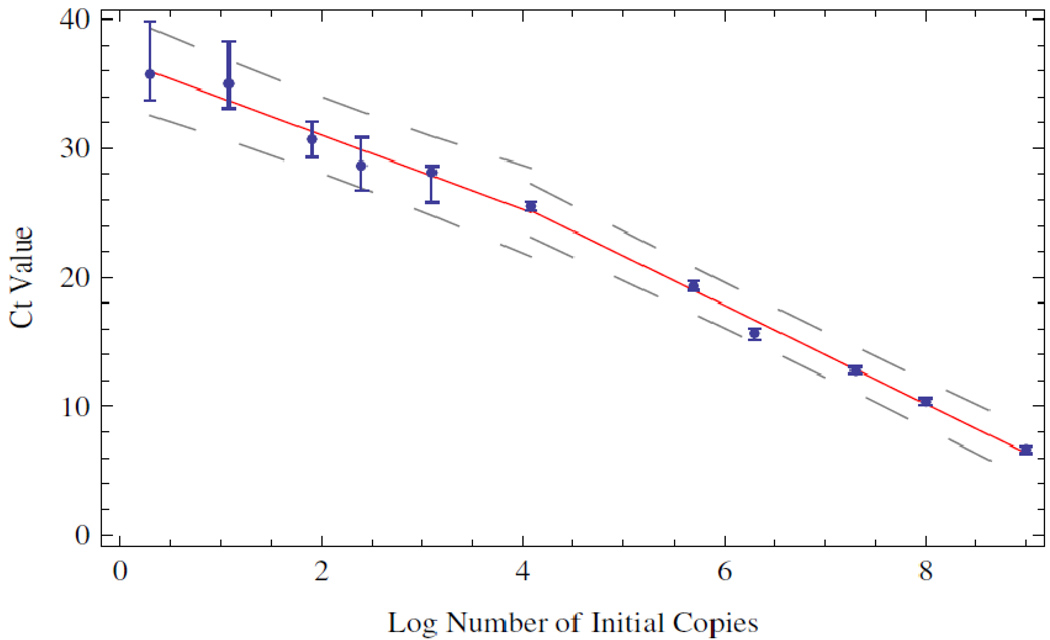
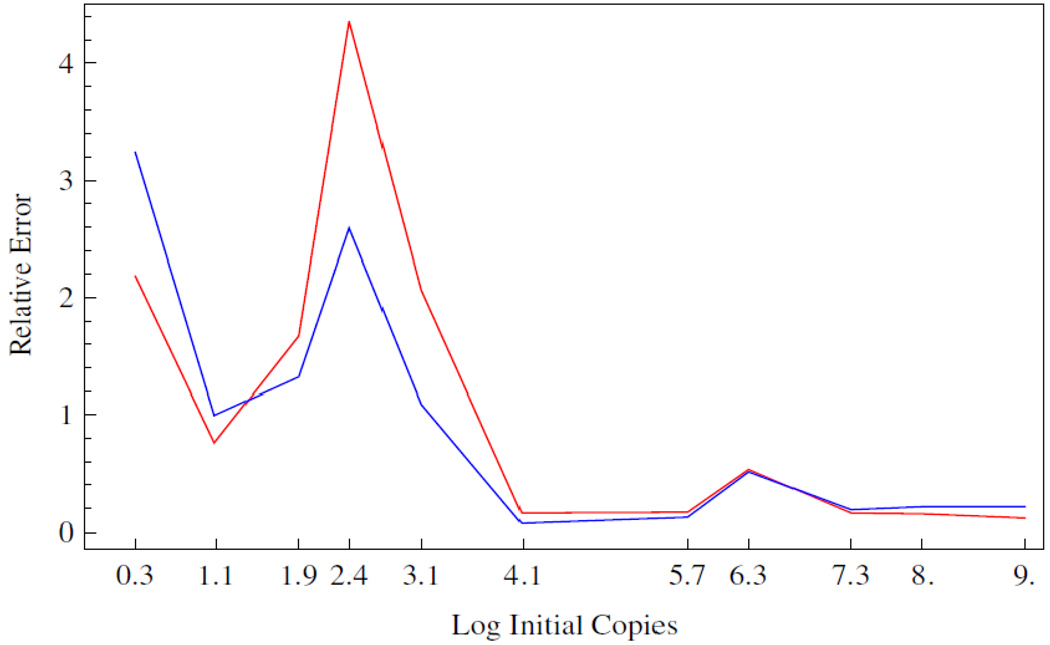
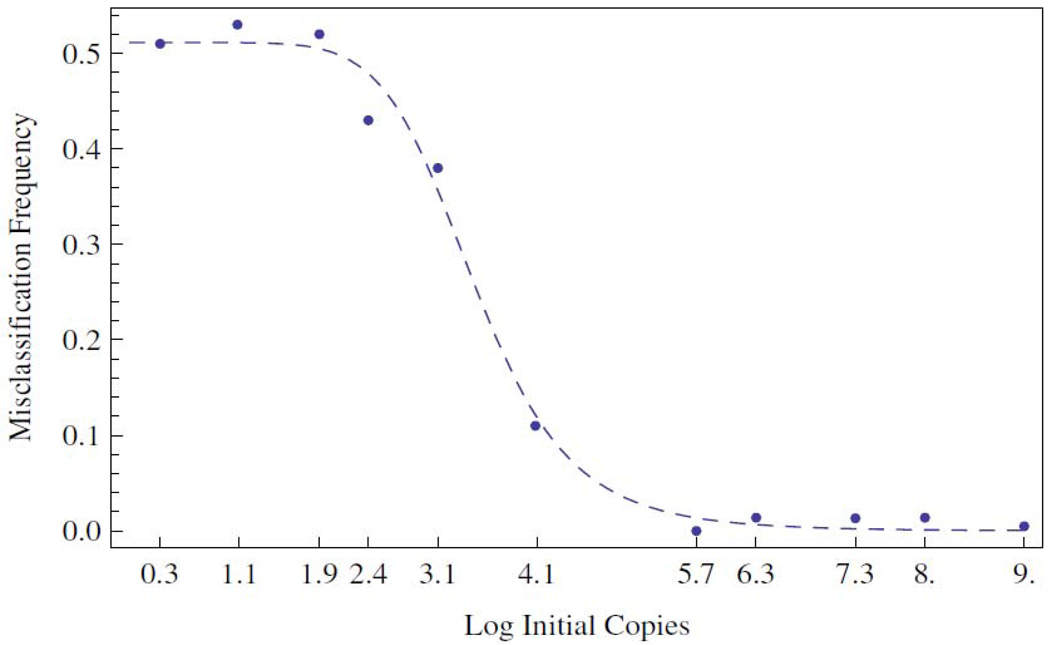
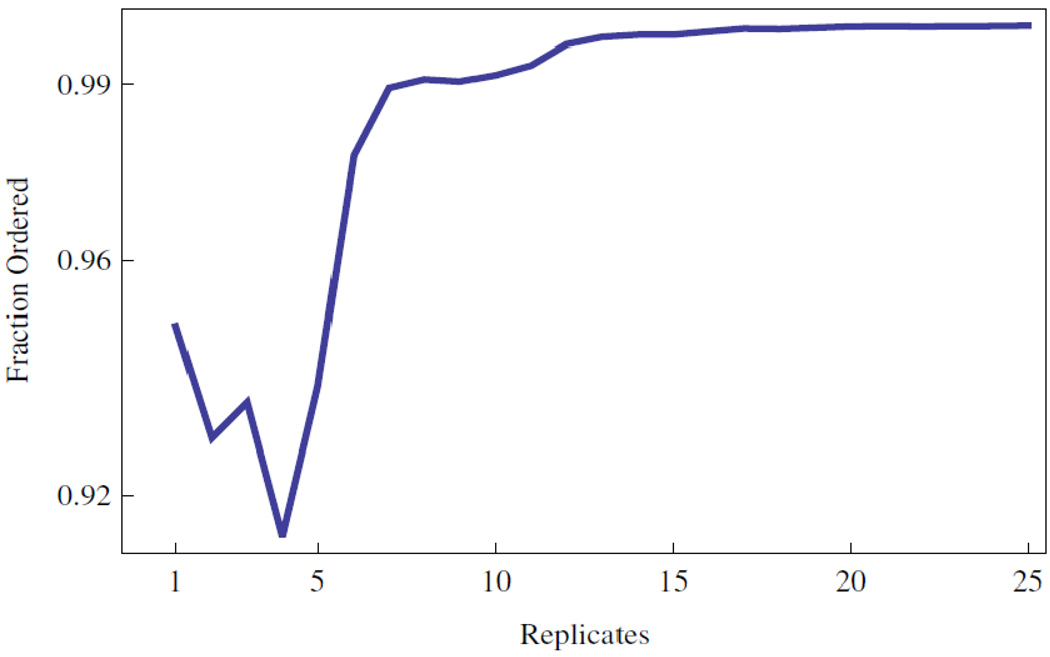
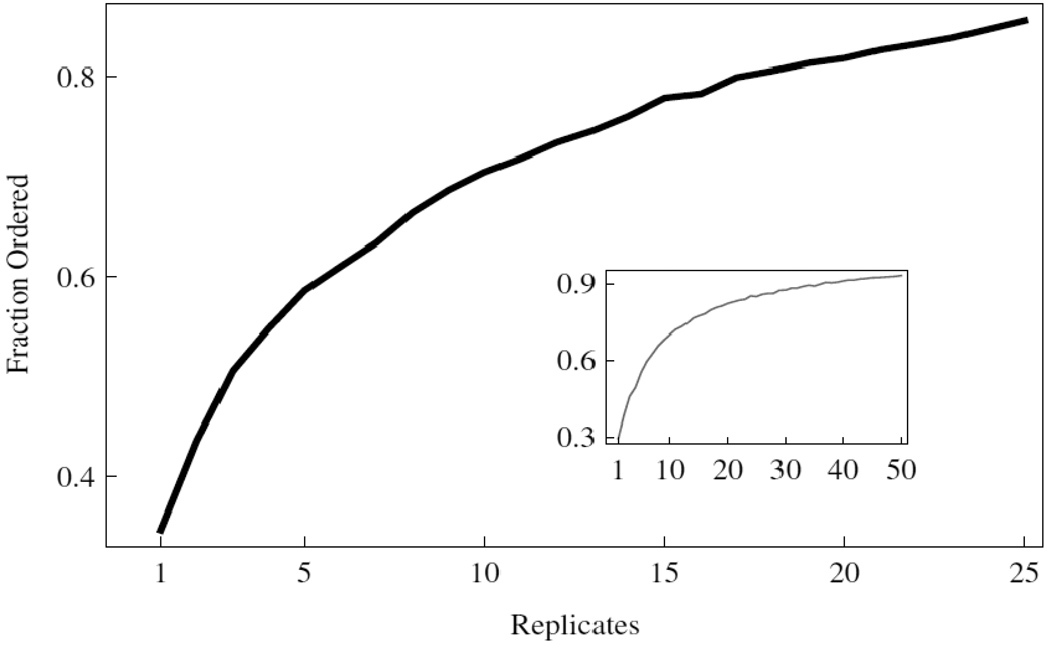
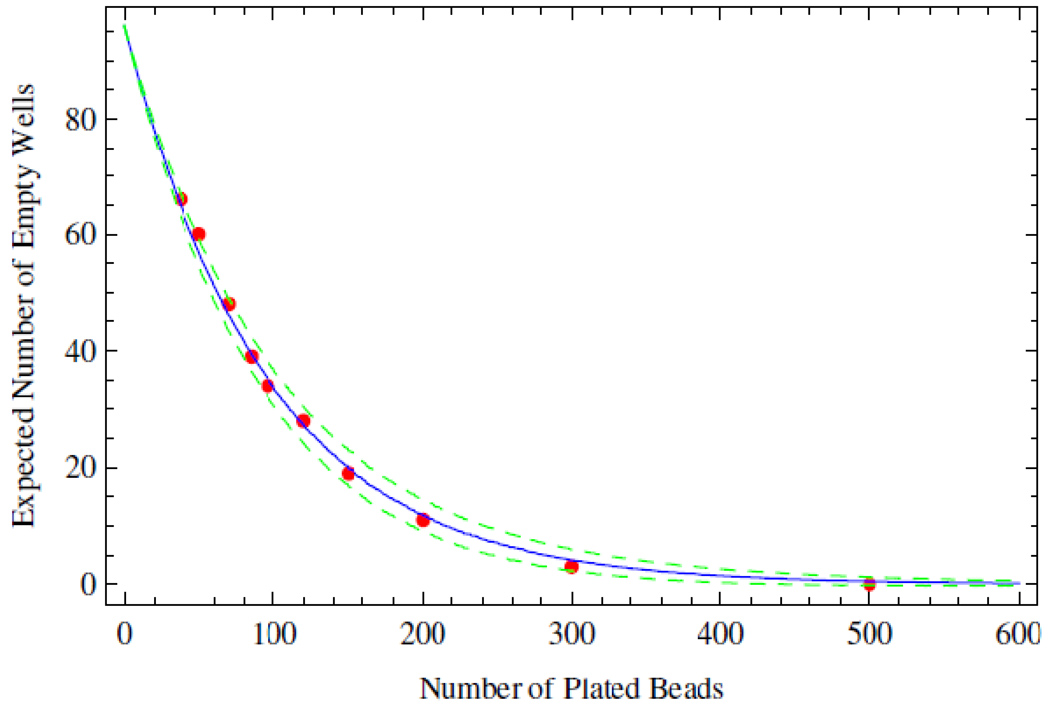
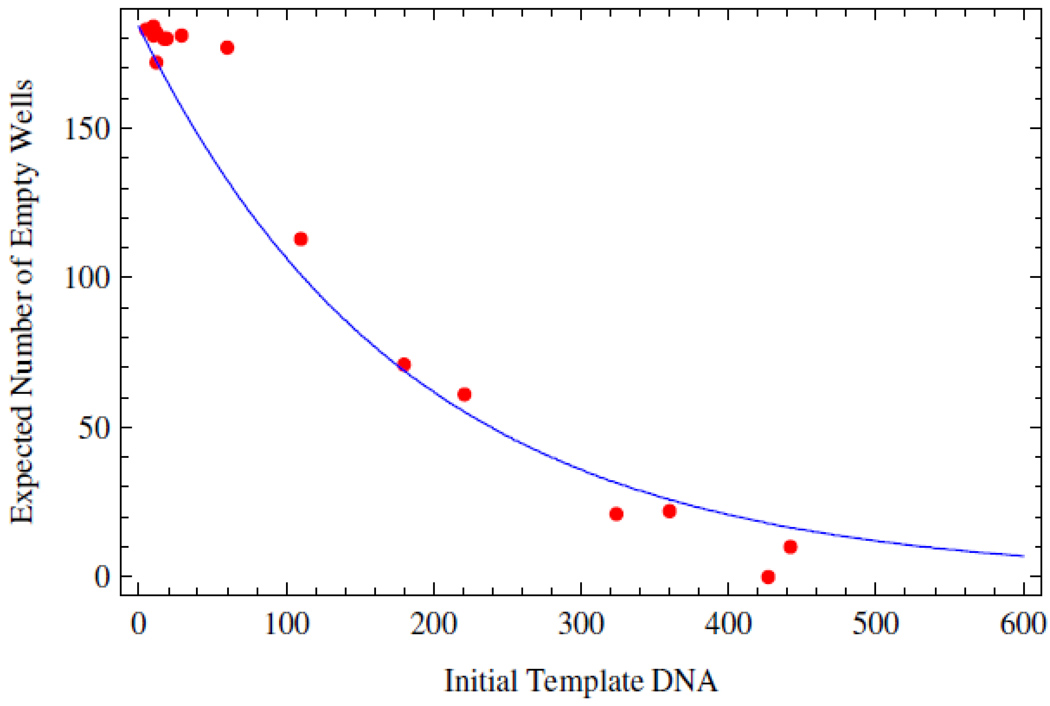
There is considerable interest in quantitatively measuring nucleic acids from single cells to small populations. The most commonly employed laboratory method is the real-time polymerase chain reaction (PCR) analyzed with the crossing point or crossing threshold (C(t)) method. Utilizing a multiwell plate reader we have performed hundreds of replicate reactions at each of a set of initial conditions whose initial number of copies span a concentration range of ten orders of magnitude. The resultant C(t) value distributions are analyzed with standard and novel statistical techniques to assess the variability/reliability of the PCR process. Our analysis supports the following conclusions. Given sufficient replicates, the mean and/or median C(t) values are statistically distinguishable and can be rank ordered across ten orders of magnitude in initial template concentration. As expected, the variances in the C(t) distributions grow as the number of initial copies declines to 1. We demonstrate that these variances are large enough to confound quantitative classification of the initial condition at low template concentrations. The data indicate that a misclassification transition is centered around 3000 initial copies of template DNA and that the transition region correlates with independent data on the thermal wear of the TAQ polymerase enzyme. We provide data that indicate that an alternative endpoint detection strategy based on the theory of well mixing and plate filling statistics is accurate below the misclassification transition where the real time method becomes unreliable.


Figures

Figure 1
Figure 1
Summary of the Ct value data, stratified as a function of the log of the initial number of copies of DNA amplified. As described in methods, a minimum of 175 replicates were run at each initial condition. The box covers two quartiles about the median with outliers shown as the red dots. Outliers are defined as points beyond 3/2 the discrete interquantile range from the edge of the box.
Figure 2
Figure 2
Linear regression of the mean Ct values with log initial copy number. The regression line is shown in red along with a 95% confidence interval in dashed line. The error bars on the individual data points reflect one standard deviation computed from the Ct value distributions.
Figure 3
Figure 3
TAQ efficiency as a function of thermo-cycling pre-wear. An efficiency is computed as the average derivative of relative fluorescence over the amplification curves. Error bars represent a standard deviation over three independent experiments.
Figure 4
Figure 4
Piecewise linear regression of the mean Ct values. The data were split according to the trends observed in Figures 1 and 3.
Figure 5
Figure 5
Relative error of the PCR process as calculated from the Ct value distributions and the standard curves shown in Figures 2 and 4, Blue and Red respectively. The Ct values corresponding to the first and third quartile were used to calculate a ΔDNA value whose limits were calculated using the regression line(s), according to the definition of Δnn given in section 2.4.
Figure 6
Figure 6
Misclassification frequency calculated according to the definition of P(x) given in section 2.4 and conditioned upon the Ct value distributions shown in Figure 1. A best fit Hill's function is shown as the dashed line. The midpoint of the transition occurs at approximately 2950 copies of initial template DNA.
Figure 7
Figure 7
Reliability of replicates given the task of rank ordering a dilution series. The results for rank ordering the initial template concentrations with x ≥ 104.
Figure 8
Figure 8
Reliability of replicates given the task of rank ordering a dilution series. The results for rank ordering the initial template distributions with x < 104. Inset shows the results over the entire range of initial template DNA, see Table 1.
Figure 9
Figure 9
Agreement between experimental and theoretical plate filling statistics. The expected number of empty wells is shown as a function of the total number of beads distributed among the wells of a 96-well plate. The expected number of unfilled wells calculated from theory is shown as the solid blue line, while one standard deviation is shown as the dotted green line. Experimental data are shown in red.
Figure 10
Figure 10
The number of unamplified wells as a function of the number of DNA molecules spread over a 384 well plate. The expected number of empty wells calculated from theory in blue. The red dots represent experimental PCR endpoint data.

References

    1. Freeman W, Walker S, Vrana K. Quantitative rt-PCR: pitfalls and potential. Biotechniques. 1999;26:112–125. - PubMed
    1. Larionov A, Krause A, Miller W. A standard curve based method for relative real time PCR data processing. BMC Bioinformatics. 2005;6:62. - PMC - PubMed
    1. Yuan J, Reed A, Chen F, Stewart C. Statistical analysis of real-time PCR data. BMC Bioinformatics. 2006;7:85. - PMC - PubMed
    1. Abramov D, Trofimov D, Rebrikov D. Accuracy of a real-time polymerase chain-reaction assay for quantitative estimation of genetically modified food sources in food products. Applied Biochemistry and Microbiology. 2006;42:485–488. - PubMed
    1. Diehl F, Li M, Dressman D, Yiping H, Shen D, Szabo S, Diaz L, Goodman S, David K, Juhl H, Kinzler K, Vogelstein B. Detection and quantification of mutations in the plasma of patients with colorectal tumors. PNAS. 2005;102:16368–16373. - PMC - PubMed

LinkOut - more resources