. 2010 Sep;30(5):703-22.
doi: 10.1007/s10875-010-9441-2. Epub 2010 Jul 16.

Diversity in CD8(+) T cell function and epitope breadth among persons with genital herpes

Affiliations

Diversity in CD8(+) T cell function and epitope breadth among persons with genital herpes

Kerry J Laing et al. J Clin Immunol. 2010 Sep.

Abstract

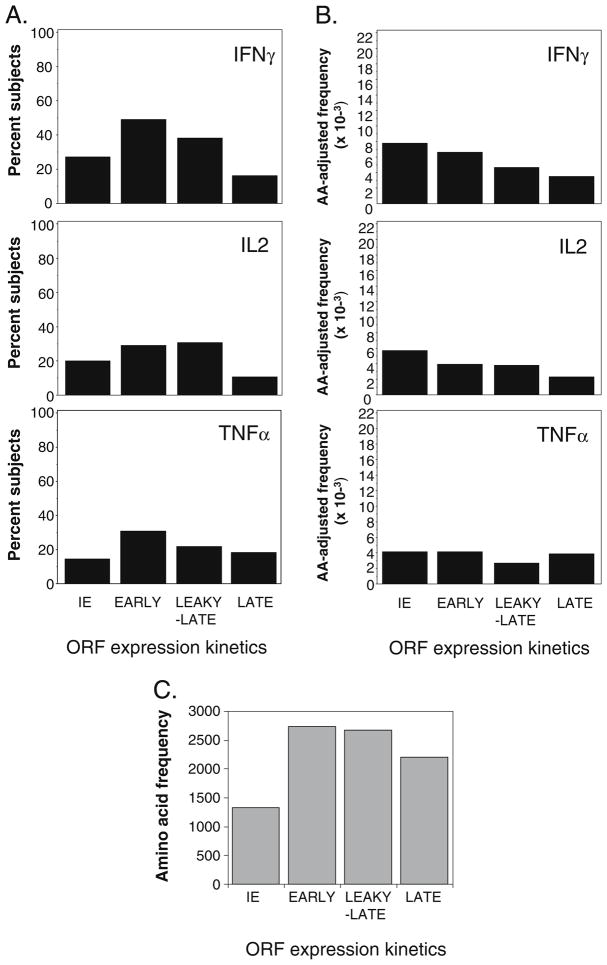
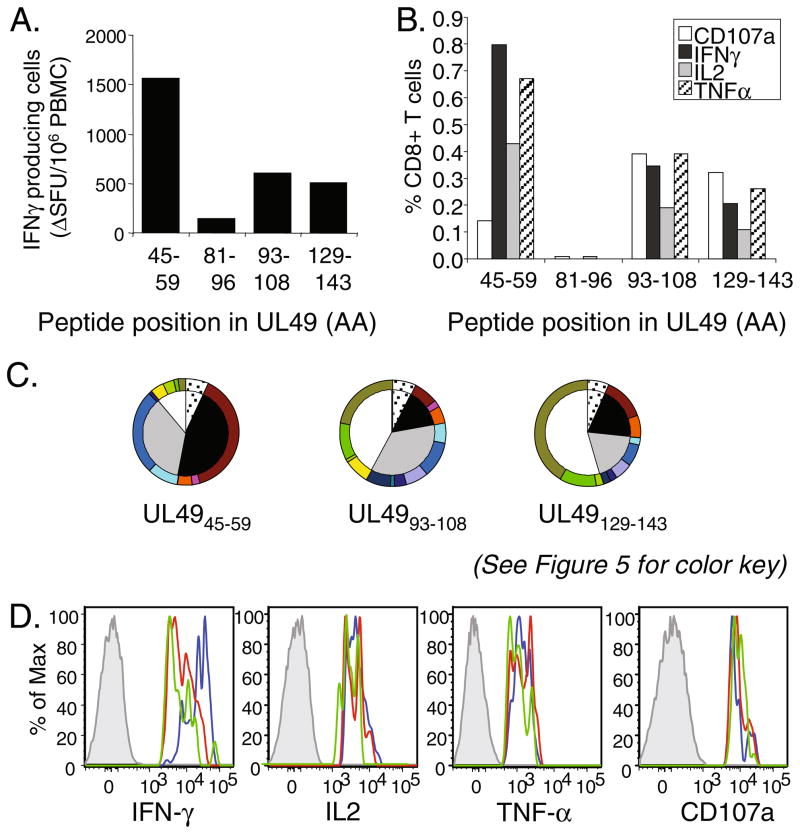
CD8(+) T cells are known to be important in clearing herpes simplex virus (HSV) infections. However, investigating the specific antiviral mechanisms employed by HSV-2-specific T cell populations is limited by a lack of reagents such as CD8(+) T cell epitopes and specific tetramers. Using a combination of intracellular cytokine staining flow cytometry and ELISpot methods, we functionally characterized peripheral HSV-2-specific CD8(+) T cells from peripheral blood mononuclear cell (PBMC) that recognize 14 selected HSV-2 open-reading frames (ORFs) from 55 HSV-2 seropositive persons; within these ORFs, we subsequently identified more than 20 unique CD8(+) T cell epitopes. CD8(+) T cells to HSV-2 exhibited significant heterogeneity in their functional characteristics, proliferation, production of inflammatory cytokines, and potential to degranulate ex vivo. The diversity in T cell response in these ex vivo assessments offers the potential of defining immune correlates of HSV-2 reactivation in humans.


Figures

Fig. 1
Fig. 1
Percentage of HSV-2 seropositive (a; N=55) or seronegative (b; N=18) individuals, detected by high-throughput ICS analysis, who display specific immune responses against a given HSV-2 ORF in their CD8+ T cell population. Responses are displayed as the percent of individuals with CD8+ T cells positive for any of the three observed cytokines (IFN-γ, IL-2, or TNF-α; top panels), as well as the percentage with detectable responses observed separately for each cytokine; the individual cytokine responses were determined by observing total cell frequencies expressing a given cytokine regardless of whether or not other cytokines are co-expressed. The amino acid sizes of each ORF are shown in the bottom panels. The percentages of CD8+ T cells expressing each cytokine in positively scored responses to HSV-2 peptide pools are shown for seropositive (c) and seronegative (d) subjects; the values presented represent percentage of cytokine-positive CD8+ T cells exposed to HSV-2 peptides minus the percentage of cytokine-positive CD8+ T cells exposed to DMSO. The dashed line represents 0.05% CD8+ T cells
Fig. 2
Fig. 2
Comparison of responses to ORFs with different expression kinetics. ORFs are grouped according to their expression kinetics (immediate-early [IE], early, leaky-late, or late) as listed in Table I, and the frequency of persons with positive responses was determined for each category. a The percentage of subjects with positive cytokine (IFN-γ, IL-2, or TNF-α) responses to HSV-2 peptides. b The percentage of subjects divided by the number of amino acids (AA) represented per ORF class. c The number of amino acids contained per ORF class
Fig. 3
Fig. 3
HSV-2-specific T cell populations are polyfunctional. High- throughput ICS assays were used to detect expression of the functional markers IFN-γ, IL-2, TNF-α, and CD107a in T cells that react to HSV-2-derived peptide pools. The proportion of HSV-2-specific CD8+ T cells that expressed one, two, three, or all four of these markers was determined—these data are summarized as pie charts, where one pie represents the proportional average of responding T cells for all individuals with responses to a given ORF. Each section of the pie represents cells that express one (yellow), two (blue), three (red), or four (black) of the functional markers. Qualitative representation of the 15 distinct combinations of functional markers on responsive HSV-2 ORF-specific CD8+ T cells are shown as dot plots, where each graph represents a distinct ORF and each dot per column represents a unique individual. The number of responding individuals (n) per ORF is given. Values shown on the y-axes of each graph represent the percent of the total CD8+ T cells that express functional markers
Fig. 4
Fig. 4
Confirmation of a novel 9-mer epitope embedded in UL25 that is antigenic in HLA-A2 possessing individuals. a Decreasing concentrations of the UL25369–383 15-mer (dashed lines and black boxes) and UL25372–380 9-mer (solid line and white circles) were assessed by ELISpot for their ability to induce secretion of IFN-γ from CD8+ T cells within PBMC of known responders to the 15-mers. IFN-γ release was detected at low doses (<10−10 M) of peptide. All responding individuals possessed an HLA-A2 allele. b Binding analyses comparing the affinity (IC50; nM) of UL25372–380 for different HLA-A*02 proteins, or the unrelated HLA-A*6802 molecule. c Representative surface staining of CD3+CD8+ lymphocytes from a responsive HSV-2 seropositive individual with HLA-A*0201 tetramers binding FLWEDQTLL (HSV-2 UL25 epitope) or NVLPMVATV (CMV pp65 epitope). Lack of staining of cells from an HLA-A*0201 negative individual is shown for comparison. Plots represent an average of duplicate analyses
Fig. 5
Fig. 5
a Comparing the frequency of IFN-γ+CD8+ T cells recalled by single HSV-2 peptides (shaded bars) and peptide pools (white bars) in selected HSV-2 seropositive subjects with mapped responses. Each distinct shading pattern in bars for single peptide responses represents a unique peptide within a given ORF. b Changes in median fluorescence intensity (ΔMFI) of IFN-γ, IL-2, TNF-α, and CD107a in monofunctional and polyfunctional CD8+ T cells following exposure to HSV-2-specific peptides or to SEB. Average responses of all individual peptide responses within an individual were calculated to reduce bias. Distinct combinations of functional markers are indicated below box-plots. For box-plots, gray boxes represent the 25–75% range, and bars represent the 5–95% range, while the horizontal line within the bar represents the median. Significantly different groups (n=8; Friedman’s non-parametric test followed by Conover; p<0.05) are indicated with distinct letters (a, b, c, or d), thus groups not found different will share the same letter. c Individual peptides from HSV-2 ORFs activate polyfunctional cells, most of which are IFN-γ positive. Single 15-mers derived from HSV-2 ORFs UL39, ICP0, UL25, or UL49 were used to specifically stimulate PBMC in responsive individuals in vitro. Cytokine production and CD107a expression were detected in CD8+ T cells by ICS; the relative proportions of responsive cells stained with one, two, three, or four functional markers are presented as pie charts. For each antigen, the total number of responsive cells detected by ICS per million CD8+ T cells is shown below the pies. Mono- and polyfunctional cell proportions are shown, as per color key, in the outer circles
Fig. 6
Fig. 6
Multiple HSV-2 epitope-specific T cells can be detected within a single individual. a ELISpot detection of IFN-γ production in PBMC incubated in the presence of HSV-2 UL49 specific peptides in a single HSV-2 seropositive subject. b ICS detection of IFN-γ, IL-2, TNF-α, and CD107a in CD8+ T cells of a single HSV-2 seropositive individual following incubation of PBMC with UL49 specific peptides. Bars show percent of CD8+ T cells that express each marker. c Proportions of CD8+ T cells that express one, two, three, or four functional markers for three UL49-derived peptides are shown in the central pies; outer circles show representative phenotypes. The same color key was used as shown in Fig. 5. d Relative levels of each of the four functional proteins, estimated by median fluorescence intensity levels. Gray shaded histogram represents cells negative for a given protein; blue, red, and green histograms represent CD8+ T cells specific for peptides UL4945–59, UL4993–108, or UL49129–143, respectively
Fig. 7
Fig. 7
Detection of granzyme B and perforin in HSV-2-specific CD8+ T cells. a Representative plot of IFN-γ+ cells in CD8+ T cells versus either granzyme B (GrzB) or perforin (Perf) following challenge with DMSO (negative control), SEB, or HSV-2 peptide. b The proportion of CD8+IFNγ+ T cells that express, co-express or lack Perf or GrzB following stimulation with HSV-2 peptides (averaged response of multiple peptides within an individual) or SEB. Each row represents a different subject. c CD8+ T cells were separated into GrzB+ and GrzB populations, and the percent IFN-γ+ events quantified following stimulation with HSV-2 peptides or DMSO (negative control). Boxplots compare the average response per subject for all HSV-2 peptides, or DMSO control, in GrzB+ or GrzB CD8+ T cells. d As in panel c with Perforin+ and Perforin populations. e Box-plots comparing the change in median fluorescence intensity (ΔMFI) of GrzB in CD8+ T cells co-expressing perforin and/or IFN-γ. f Box-plots comparing the change in median fluorescence intensity (ΔMFI) of perforin in CD8+ T cells co-expressing GrzB and/or IFN-γ. For all box plots (cf), gray boxes represent 25–75% range, and bars represent the 5–95% range, while the horizontal line within the bar represents the median (n=6). Letters (a, b, or c) displayed above the bars indicate differences between groups; if groups are significantly different (Friedman non-parametric test with Conover posthoc test for pairs; p≤0.05) within a graph, they are assigned a distinct letter. g Functional phenotypes (as per Fig. 3) of activated CD8+ T cells observed during ICS assays in cells stimulated with the same epitopes used to detect granzyme and perforin in HSV-2-specific T cells
Fig. 8
Fig. 8
The proliferative capacity of HSV-2-specific CTL was estimated by measuring the frequency of CFSElo CD8+ T cells following incubation with HSV-2 derived peptides. PBMC of HSV-2 seropositive individuals were incubated with previously determined stimulatory peptides, negative control (DMSO), or positive control stimuli. CD3+CD8+ cells were isolated by flow cytometry, and cells with ≥2× reduction in CFSE staining were counted (a); these are considered proliferated cells. CFSElo frequency of antigen-challenged cells was divided by the CFSElo frequency in negative controls to provide the cell division index (CDI); these values are shown in bar graphs for subjects tested with two peptides from distinct HSV-2 ORFs (b) and one individual tested with four distinct peptide epitopes from the same ORF, UL49 (c). Proliferation was considered positive when CDI ≥2; this value is shown with dashed lines on each graph

References

    1. Wald A, Link K. Risk of human immunodeficiency virus infection in herpes simplex virus type 2-seropositive persons: a meta-analysis. J Infect Dis. 2002;185:45–52. - PubMed
    1. Freeman EE, Weiss HA, Glynn JR, Cross PL, Whitworth JA, Hayes RJ. Herpes simplex virus 2 infection increases HIV acquisition in men and women: systematic review and meta-analysis of longitudinal studies. AIDS. 2006;20:73–83. - PubMed
    1. Koelle DM, Posavad CM, Barnum GR, Johnson ML, Frank JM, Corey L. Clearance of HSV-2 from recurrent genital lesions correlates with infiltration of HSV-specific cytotoxic T lymphocytes. J Clin Invest. 1998;101:1500–8. - PMC - PubMed
    1. Hoshino Y, Pesnicak L, Cohen JI, Straus SE. Rates of reactivation of latent herpes simplex virus from mouse trigeminal ganglia ex vivo correlate directly with viral load and inversely with number of infiltrating CD8+ T cells. J Virol. 2007;81:8157–64. - PMC - PubMed
    1. Zhu J, Koelle DM, Cao J, Vazquez J, Huang ML, Hladik F, et al. Virus-specific CD8+ T cells accumulate near sensory nerve endings in genital skin during subclinical HSV-2 reactivation. J Exp Med. 2007;204:595–603. - PMC - PubMed

Publication types

MeSH terms