Multicenter Study
. 2010 Jul;22(7):874-85.
doi: 10.1080/09540120903483034.

Measuring depression levels in HIV-infected patients as part of routine clinical care using the nine-item Patient Health Questionnaire (PHQ-9)

Affiliations
Multicenter Study

Measuring depression levels in HIV-infected patients as part of routine clinical care using the nine-item Patient Health Questionnaire (PHQ-9)

P K Crane et al. AIDS Care. 2010 Jul.

Abstract

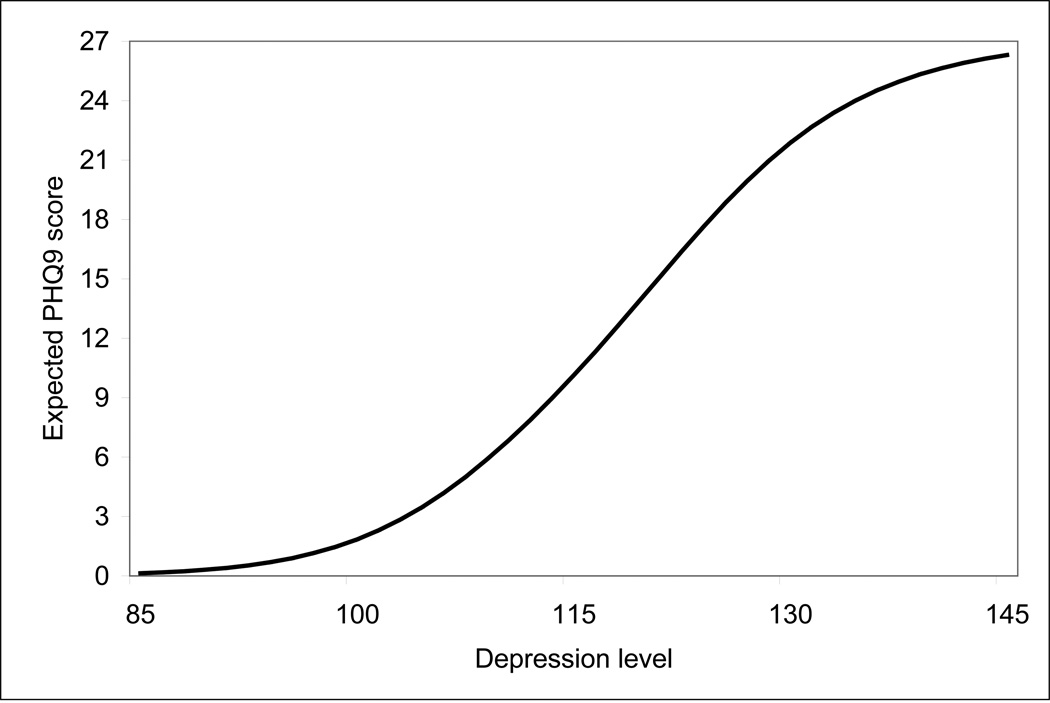
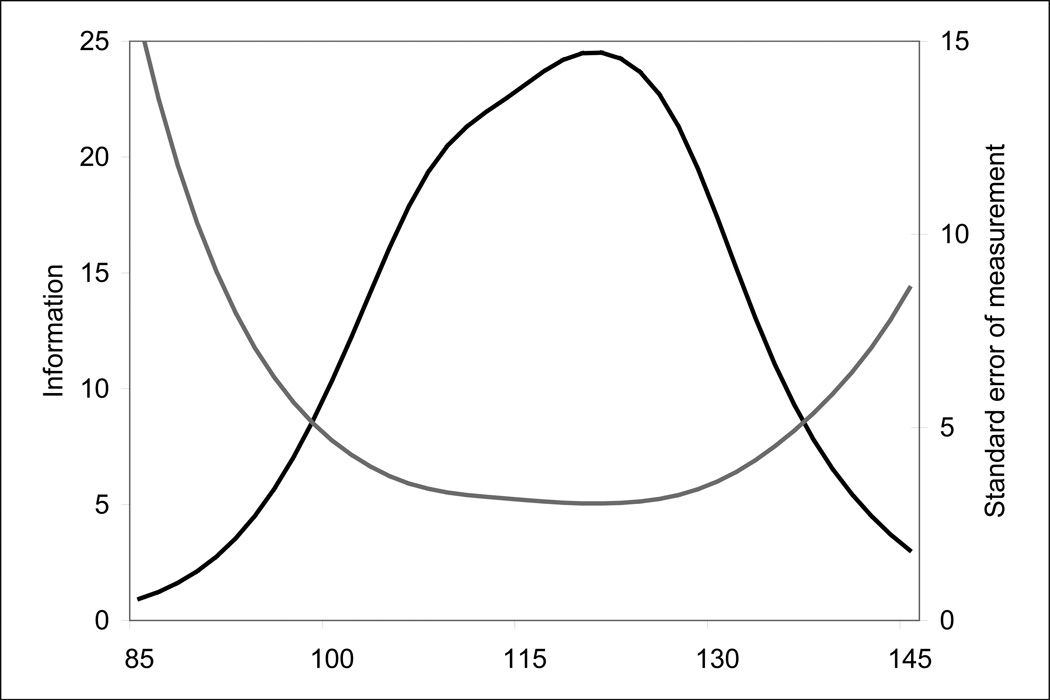
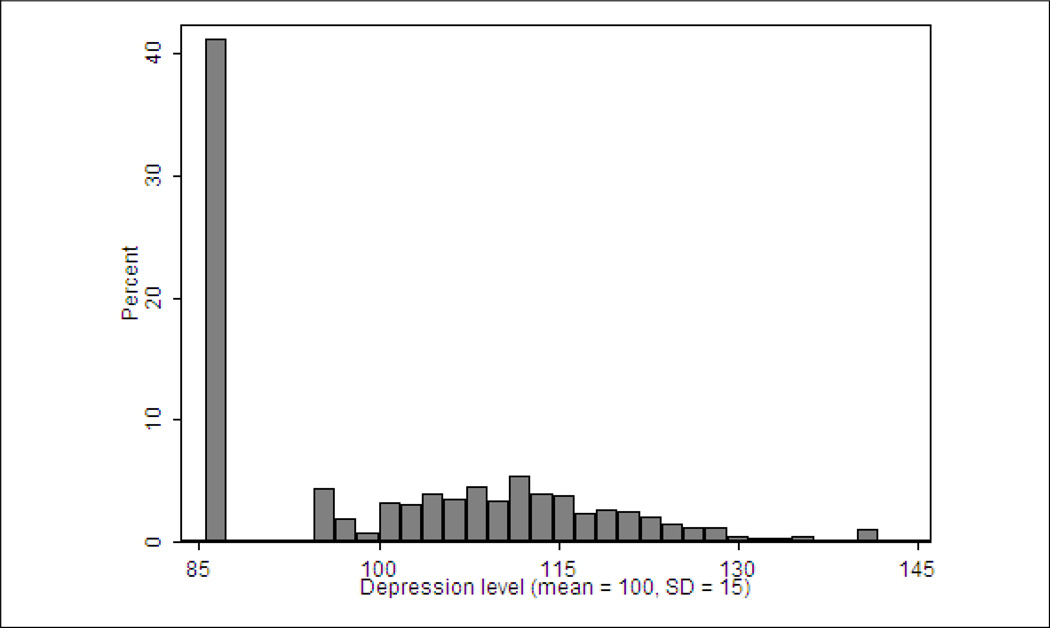
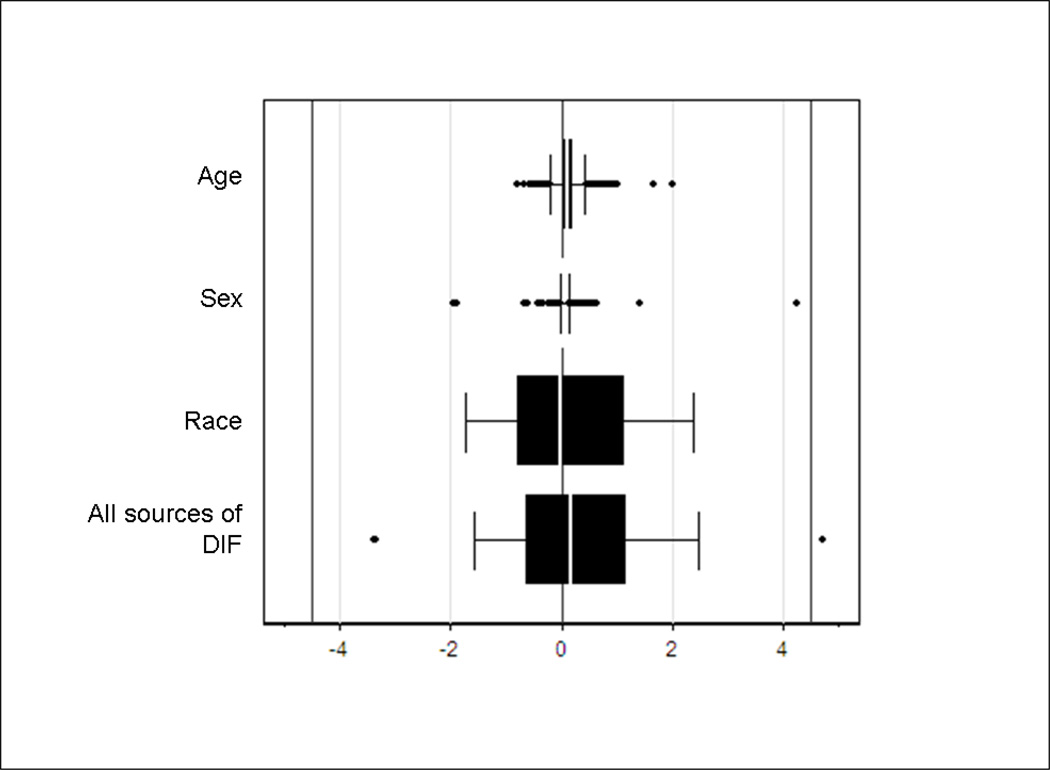
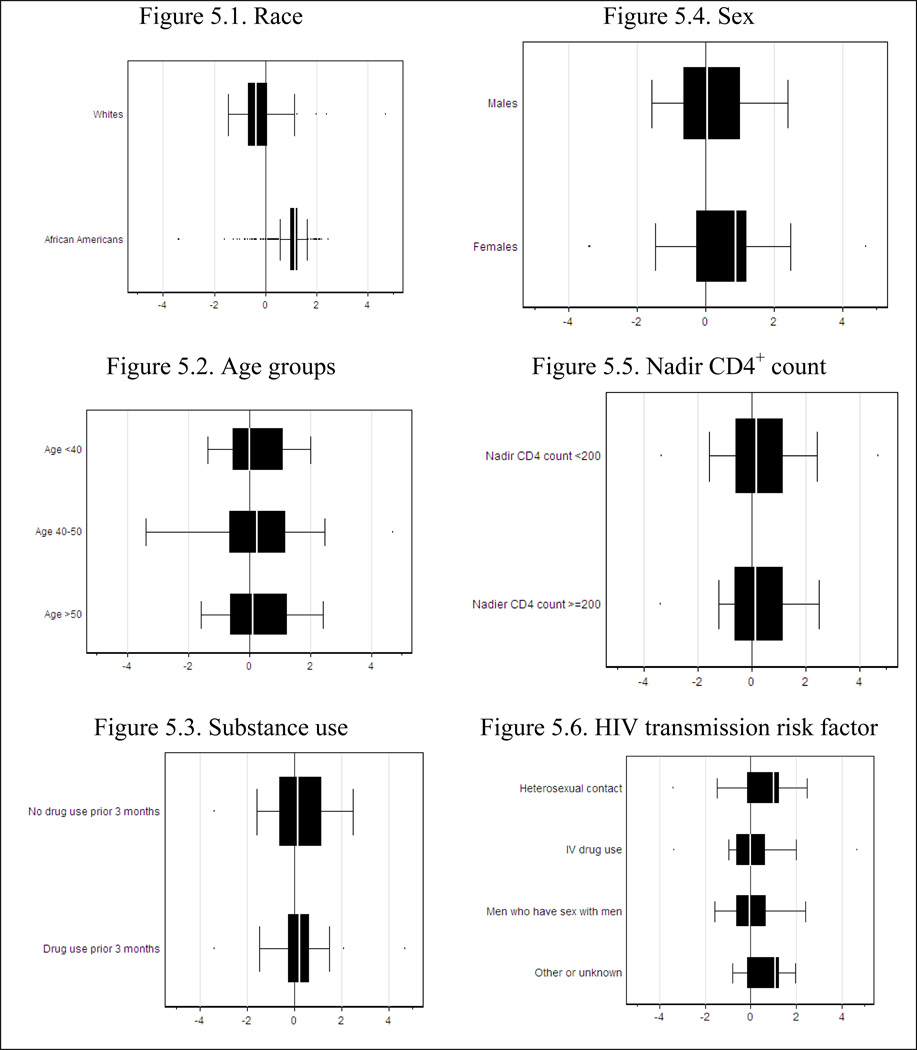
Little is known about the psychometric properties of depression instruments among persons infected with HIV. We analyzed data from a large sample of patients in usual care in two US cities (n=1467) using the nine-item Patient Health Questionnaire (PHQ-9) from the PRIME-MD. The PHQ-9 had curvilinear scaling properties and varying levels of measurement precision along the continuum of depression measured by the instrument. In our cohort, the scale showed a prominent floor effect and a distribution of scores across depression severity levels. Three items had differential item functioning (DIF) with respect to race (African-American vs. white); two had DIF with respect to sex; and one had DIF with respect to age. There was minimal individual-level DIF impact. Twenty percent of the difference in mean depression levels between African-Americans and whites was due to DIF. While standard scores for the PHQ-9 may be appropriate for use with individual HIV-infected patients in cross-sectional settings, these results suggest that investigations of depression across groups and within patients across time may require a more sophisticated analytic framework.


Figures

Figure 1
Figure 1
Test characteristic curve for the PHQ-9* * This graph plots the most likely standard PHQ-9 score associated with each level of depression. Item response theory scores were transformed to have a mean of 100 and a standard deviation of 15. At the mean level of depression in this cohort (depression level of 100), the expected PHQ-9 score is only 2 points. This means that the PHQ-9 provides very little discrimination among individuals with very low levels of depression. The sigmoid shape of the test characteristic curve implies that differences between standard scores have different implications depending on the starting value. For example, for individuals with severe levels of depression (standard PHQ-9 scores over 20), the curve is flatter than for individuals with moderate levels of depression (standard PHQ-9 scores over 10). The same 5 standard score points implies more change in depression for someone whose baseline score was 25 than for someone whose baseline score was 15. Curvilinear scaling has implications for longitudinal analyses (where rates of change are not uniform across levels of depression) and for cross-sectional regression analyses (where a single coefficient is used to describe the relationship between a 1-unit change in depression and some other variable).
Figure 2
Figure 2
Test information curve and standard error of measurement for the PHQ-9*. * The black curve shows the amount of measurement precision (“information”) at each depression level. The gray curve shows the standard error of measurement associated with each depression level. The PHQ-9 is characterized by fairly good reliability for individuals with depression levels from 100–130, while below 100 the reliability of the instrument is quite limited, and above 130 or so the reliability again begins to diminish. The clinical implication of this finding is that PHQ-9 scores between 100 and 135 or so are characterized by a standard error of 5 points or fewer, while scores below 100 and above 135 are characterized by larger standard errors. This means those with low levels of depression (<100 points) and high levels of depression (>135 points) are measured less accurately than those with moderate levels of depression. These results are to be contrasted with Crohnbach’s alpha, which would provide a single omnibus statistic summarizing reliability as if it were a constant across the range of depression measured by the test. Item response theory (IRT) output provides both the point estimate of the individual’s score along with the standard error associated with that score. Clinicians should become used to seeing both of these results reported.
Figure 3
Figure 3
Histogram of depression levels in this cohort (N=1452).
Figure 4
Figure 4
Individual-level DIF impact with respect to each of the covariates and with respect to all of the covariates simultaneously* * No items had DIF related to substance use, nadir CD4 count, or transmission risk factor. Vertical lines are placed at 0 (indicating no DIF) and at +4.5 and −4.5, indicating the median standard error of measurement (SEM). The first three box-and-whisker plots delineate individual-level DIF impact associated with each of the covariates evaluated in turn, while the last plot delineates individual-level DIF impact associated with all the covariates considered here. The values summarized in the box plots are the differences between the unadjusted IRT score and IRT scores that accounted for DIF associated with each covariate (first three plots) or with multiple covariates (last plot). A difference of 0 (the middle reference line) would mean that DIF made no difference for that person. Large positive values indicate that scores accounting for DIF were higher than scores that ignored DIF, which means that ignoring DIF resulted in underestimates of depression severity. Large negative values indicate that scores accounting for DIF were lower than scores that ignored DIF; thus ignoring DIF resulted in overestimates of depression severity. These box-and-whisker plots are indexed by 1× and 2× the median SEM of the PHQ-9 among these participants. Observations outside of ± 1 SEM indicate that a covariate has salient individual-level DIF impact (first three plots) or that the covariates evaluated for multiple sources of DIF considered together have salient individual-level DIF impact (last plot).
Figure 5
Figure 5
Group level DIF impact across groups defined by each of the covariates. DIF=differential functioning. In these plots, differences between scores accounting for DIF related to all covariates and the unadjusted IRT scores (depicted in the bottom plot of Figure 3) are plotted across groups defined by each of the covariates. The median effect for African-Americans is in the opposite direction of the median effect for whites (Figure 5.1).

References

    1. Adewuya AO, Ola BA, Afolabi OO. Validity of the patient health questionnaire (PHQ-9) as a screening tool for depression amongst Nigerian university students. J Affect Disord. 2006;96(1–2):89–93. - PubMed
    1. American Psychiatric Association. Task Force on DSM-IV. Diagnostic and statistical manual of mental disorders : DSM-IV. 4th ed. Washington, DC: American Psychiatric Association; 1994.
    1. Arnsten JH, Demas PA, Grant RW, Gourevitch MN, Farzadegan H, Howard AA, et al. Impact of active drug use on antiretroviral therapy adherence and viral suppression in HIV-infected drug users. J Gen Intern Med. 2002;17(5):377–381. - PMC - PubMed
    1. Balfour L, Kowal J, Silverman A, Tasca GA, Angel JB, Macpherson PA, et al. A randomized controlled psycho-education intervention trial: Improving psychological readiness for successful HIV medication adherence and reducing depression before initiating HAART. AIDS Care. 2006;18(7):830–838. - PubMed
    1. Blanch J, Rousaud A, Hautzinger M, Martinez E, Peri JM, Andres S, et al. Assessment of the efficacy of a cognitive-behavioural group psychotherapy programme for HIV-infected patients referred to a consultation-liaison psychiatry department. Psychother Psychosom. 2002;71(2):77–84. - PubMed

Publication types