Review
. 2009:2:265-77.
doi: 10.1146/annurev.anchem.1.031207.112942.

Mass spectrometry-based biomarker discovery: toward a global proteome index of individuality

Affiliations
Review

Mass spectrometry-based biomarker discovery: toward a global proteome index of individuality

Adam M Hawkridge et al. Annu Rev Anal Chem (Palo Alto Calif). 2009.

Abstract

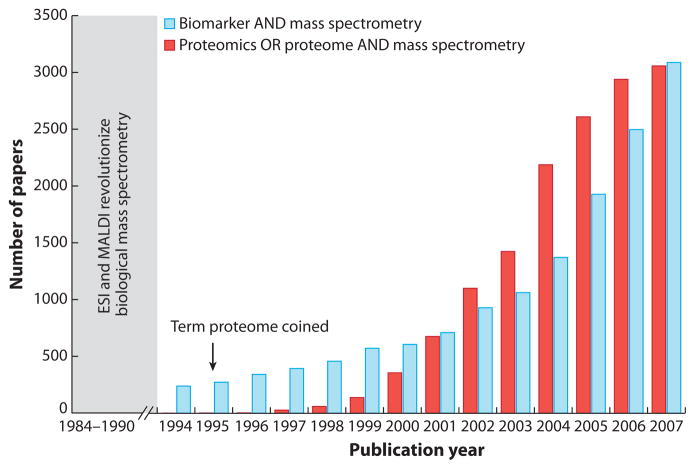
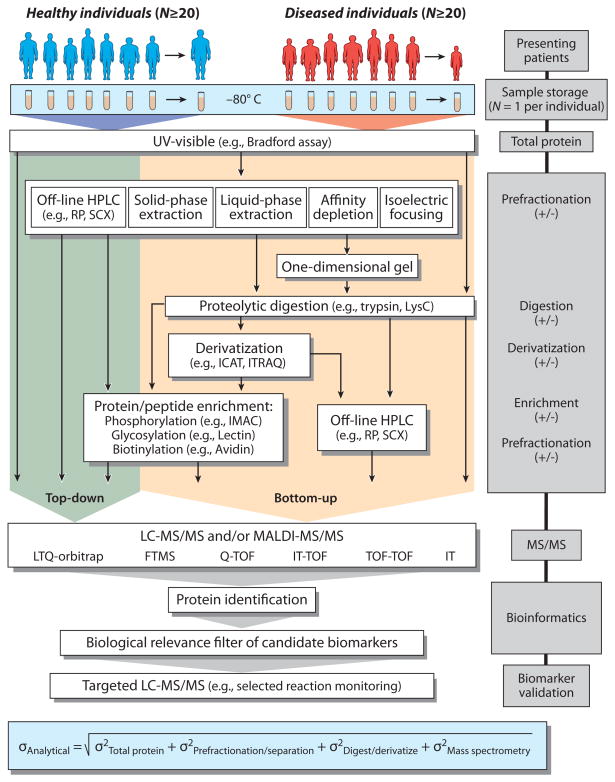
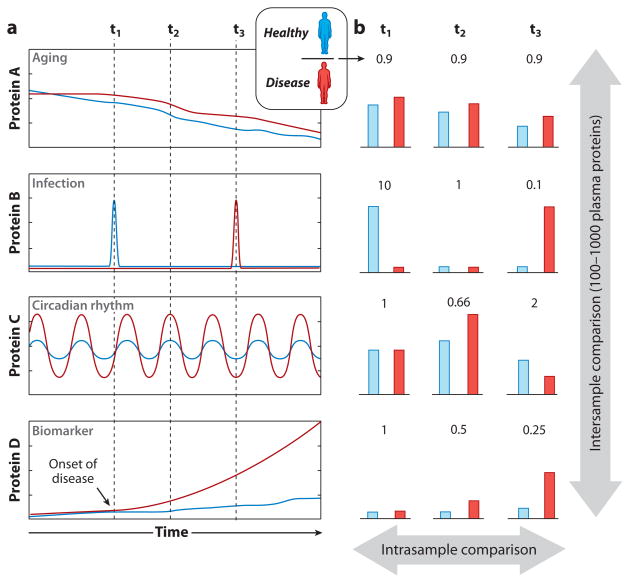
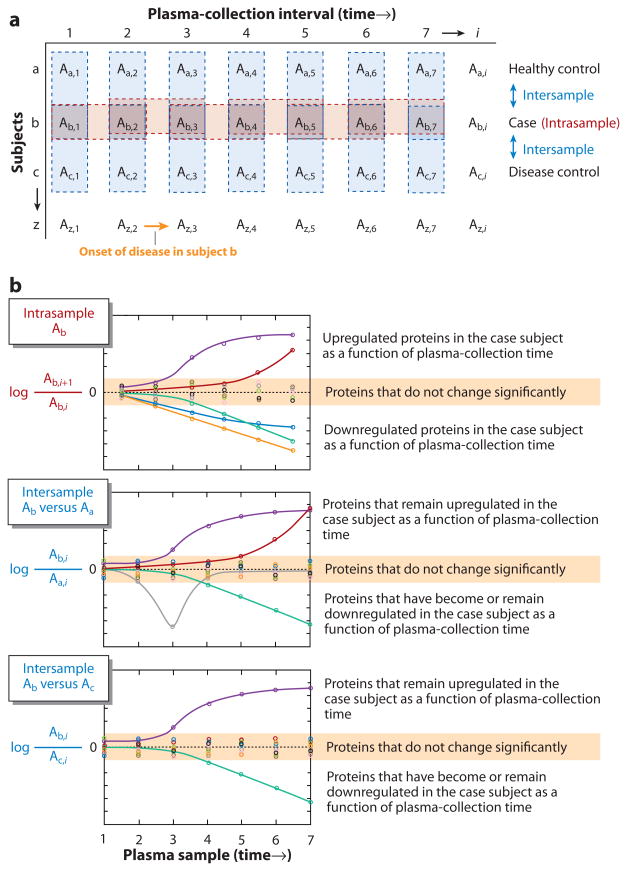
Biomarker discovery and proteomics have become synonymous with mass spectrometry in recent years. Although this conflation is an injustice to the many essential biomolecular techniques widely used in biomarker-discovery platforms, it underscores the power and potential of contemporary mass spectrometry. Numerous novel and powerful technologies have been developed around mass spectrometry, proteomics, and biomarker discovery over the past 20 years to globally study complex proteomes (e.g., plasma). However, very few large-scale longitudinal studies have been carried out using these platforms to establish the analytical variability relative to true biological variability. The purpose of this review is not to cover exhaustively the applications of mass spectrometry to biomarker discovery, but rather to discuss the analytical methods and strategies that have been developed for mass spectrometry-based biomarker-discovery platforms and to place them in the context of the many challenges and opportunities yet to be addressed.


Figures

Figure 1
Figure 1
Number of publications as a function of publication year (1994–2007) found through the Web of Science database using the search terms biomarker AND mass spectrometry and proteomics OR proteome AND mass spectrometry. Geometric growth in this field can be clearly attributed to the introduction of matrix-assisted laser desorption/ionization (MALDI) and electrospray ionization (ESI).
Figure 2
Figure 2
Typical workflows for mass spectrometry–based biomarker discovery and validation. Abbreviations: FTMS, Fourier transform mass spectrometry; HPLC, high-performance liquid chromatography; ICAT, isotope-coded affinity tag; IMAC, immobilized metal affinity chromatography; ITRAQ, isotopic tag for relative and absolute quantification; LTQ, linear trap quadrupole; MS/MS, tandem mass spectrometry; RP, reverse-phase liquid chromatography; SCX, strong cation-exchange liquid chromatography; TOF, time of flight.
Figure 3
Figure 3
(a) Hypothetical changes in the concentration of four different proteins (labeled A through D) in one healthy individual and one diseased individual as a function of time. Each protein is either up- or downregulated in relation to aging (protein A), infection (protein B), circadian rhythm (protein C), and biomarker/onset of disease (protein D). (b) The ratio of the protein concentration of the healthy individual to that of the diseased individual as a function of when the sample was collected. Typical biomarker-discovery experimental designs commonly utilize interindividual comparisons; however, intraindividual comparisons should also be an integral part of biomarker-discovery experimental designs.
Figure 4
Figure 4
Hypothetical data illustrating the power of longitudinal studies with both intra- and interindividual comparisons. (a) The blue shaded boxes represent the intersample-comparison plasma sets, and the red boxes represent the intrasample-comparison plasma sets. Subject a is the healthy control, subject b is the “case” (i.e., has the disease of interest), and subject c is the disease control (i.e., has a disease other than the one of interest). (b) In the first plot (top), the ratios of the ith +1 to the ith protein levels (Ab, i + 1/Ab,i ) for subject b are plotted as a function of sample-collection time points. The data show two upregulated proteins (upper trendlines) and three downregulated proteins (lower trendlines) relative to five proteins (center; no trendlines) that do not change significantly (highlighted in orange). Thus, there are five candidate markers for the case. (Center plot) The ratios of protein levels between subject b and a healthy patient (subject a) plotted as a function of sample-collection time points. The same two proteins remain upregulated, but two of the previously downregulated proteins cancel one another, thus falling into the insignificant region (highlighted in orange). One protein spikes downward during the time range of the study, suggesting a temporary environmental condition (e.g., infection, stress, diet, etc.). There are now three candidate biomarkers. (Bottom plot) The ratios of protein levels between subjects b and c plotted as a function of sample-collection time points. One of the upregulated proteins cancels, and the spike protein also cancels. There are now only two protein biomarker candidates that appear to track the onset and progression of the disease of interest.

References

    1. Atkinson AJ, Colburn WA, DeGruttola VG, Demets DL, Downing GJ, et al. Biomarkers and surrogate endpoints: preferred definitions and conceptual framework. Clin Pharmacol Ther. 2001;69:89–95. - PubMed
    1. Elin RJ. Instrumentation in clinical chemistry. Science. 1980;210:286–89. - PubMed
    1. Chace DH. Mass spectrometry in the clinical laboratory. Chem Rev. 2001;101:445–77. - PubMed
    1. McPherson RA, Pincus MR. Henry’s Clinical Diagnosis and Management by Laboratory Methods. 21 Philadelphia: Saunders Elsevier; 2007. p. 1450.
    1. Burtis CA, Ashwood ER, editors. Tietz Fundamentals of Clinical Chemistry. 4 W.B. Saunders; 1996. p. 881.

Publication types

LinkOut - more resources