

Cross-taxon congruence and environmental conditions
- PMID: 20637092
- PMCID: PMC2914051
- DOI: 10.1186/1472-6785-10-18
Cross-taxon congruence and environmental conditions
Abstract
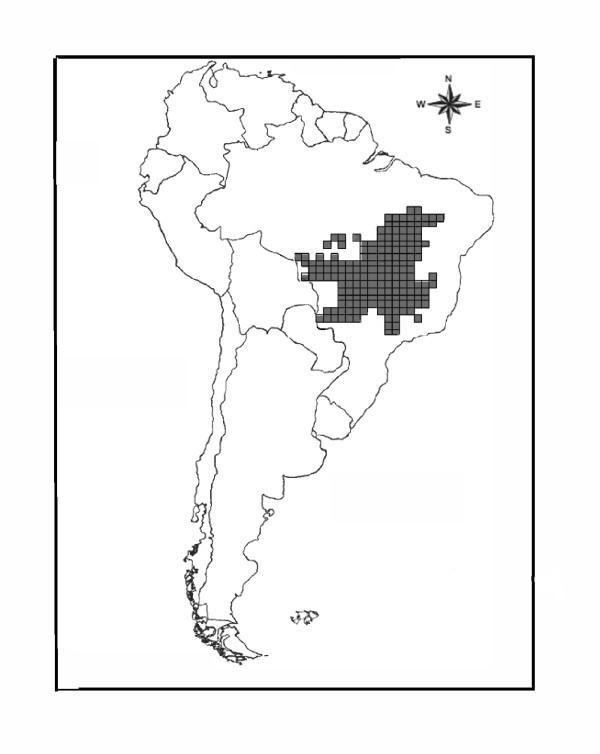
Background: Diversity patterns of different taxa typically covary in space, a phenomenon called cross-taxon congruence. This pattern has been explained by the effect of one taxon diversity on taxon diversity, shared biogeographic histories of different taxa, and/or common responses to environmental conditions. A meta-analysis of the association between environment and diversity patterns found that in 83 out of 85 studies, more than 60% of the spatial variability in species richness was related to variables representing energy, water or their interaction. The role of the environment determining taxa diversity patterns leads us to hypothesize that this would explain the observed cross-taxon congruence. However, recent analyses reported the persistence of cross-taxon congruence when environmental effect was statistically removed. Here we evaluate this hypothesis, analyzing the cross-taxon congruence between birds and mammals in the Brazilian Cerrado, and assess the environmental role on the spatial covariation in diversity patterns.
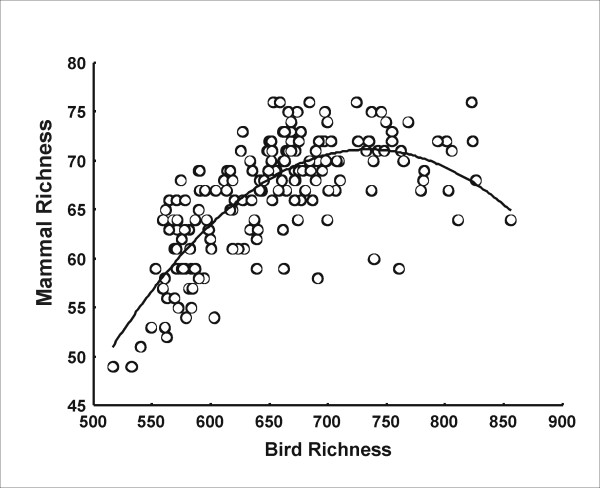
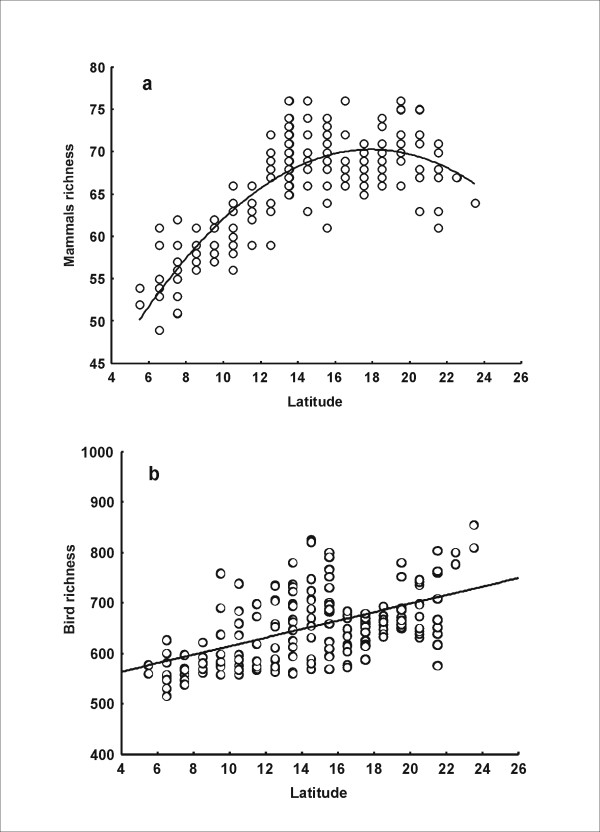
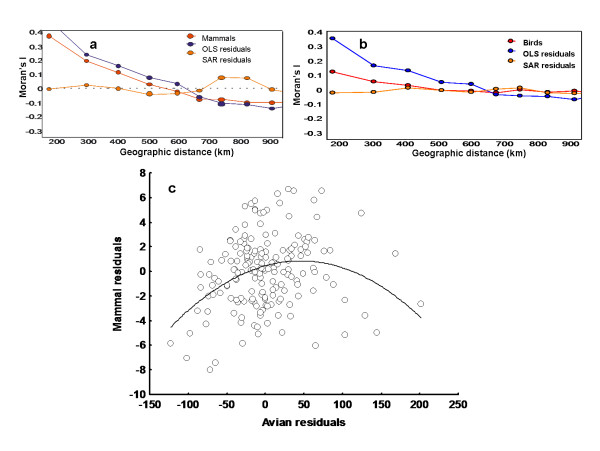
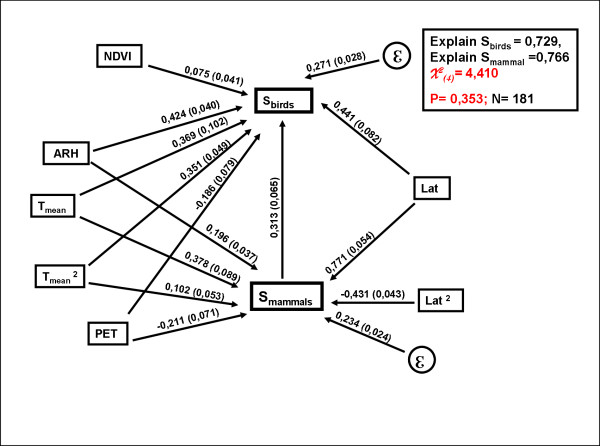
Results: We found a positive association between avian and mammal richness and a positive latitudinal trend for both groups in the Brazilian Cerrado. Regression analyses indicated an effect of latitude, PET, and mean temperature over both biological groups. In addition, we show that NDVI was only associated with avian diversity; while the annual relative humidity, was only correlated with mammal diversity. We determined the environmental effects on diversity in a path analysis that accounted for 73% and 76% of the spatial variation in avian and mammal richness. However, an association between avian and mammal diversity remains significant. Indeed, the importance of this link between bird and mammal diversity was also supported by a significant association between birds and mammal spatial autoregressive model residuals.
Conclusion: Our study corroborates the main role of environmental conditions on diversity patterns, but suggests that other important mechanisms, which have not been properly evaluated, are involved in the observed cross-taxon congruence. The approaches introduced here indicate that the prevalence of a significant association among taxa, after considering the environmental determinant, could indicate both the need to incorporate additional processes (e.g. biogeographic and evolutionary history or trophic interactions) and/or the existence of a shared trend in detection biases among taxa and regions.
Figures
References
-
- Currie DJ. Energy and Large-Scale Patterns of Animal- and Plant-Species Richness. The American Naturalist. 1991;137:27–49. doi: 10.1086/285144. - DOI
-
- Pearson DL, Carroll SS. The influence of spatial scale on cross-taxon congruence patterns and prediction accuracy of species richness. Journal of Biogeography. 1999;26:1079–1090. doi: 10.1046/j.1365-2699.1999.00337.x. - DOI
Publication types
MeSH terms
LinkOut - more resources
Full Text Sources
