

Protein phosphatase complement in rice: genome-wide identification and transcriptional analysis under abiotic stress conditions and reproductive development
- PMID: 20637108
- PMCID: PMC3091634
- DOI: 10.1186/1471-2164-11-435
Protein phosphatase complement in rice: genome-wide identification and transcriptional analysis under abiotic stress conditions and reproductive development
Abstract
Background: Protein phosphatases are the key components of a number of signaling pathways where they modulate various cellular responses. In plants, protein phosphatases constitute a large gene family and are reportedly involved in the regulation of abiotic stress responses and plant development. Recently, the whole complement of protein phosphatases has been identified in Arabidopsis genome. While PP2C class of serine/threonine phosphatases has been explored in rice, the whole complement of this gene family is yet to be reported.
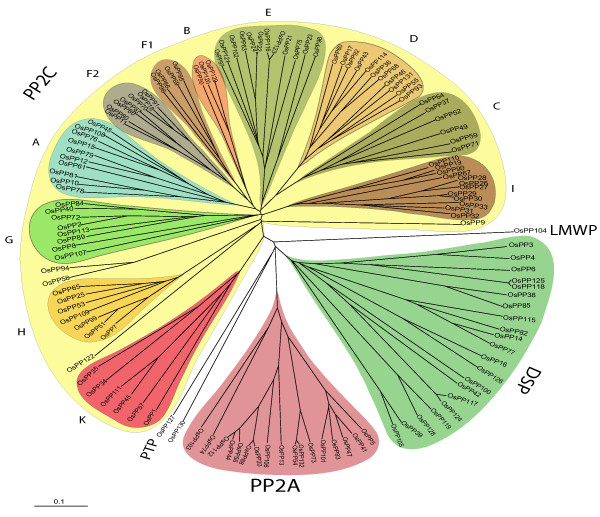
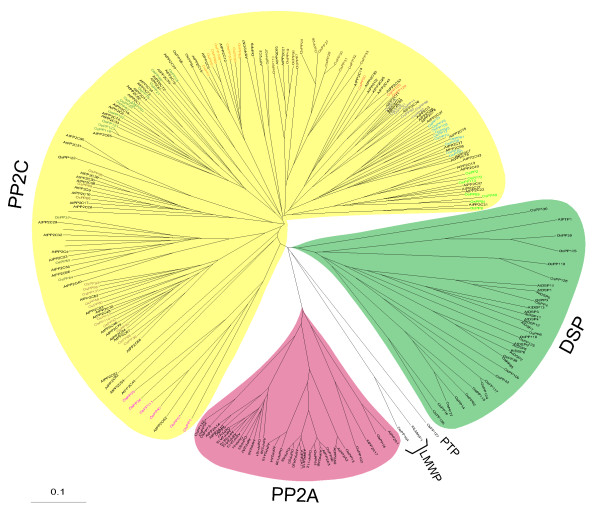
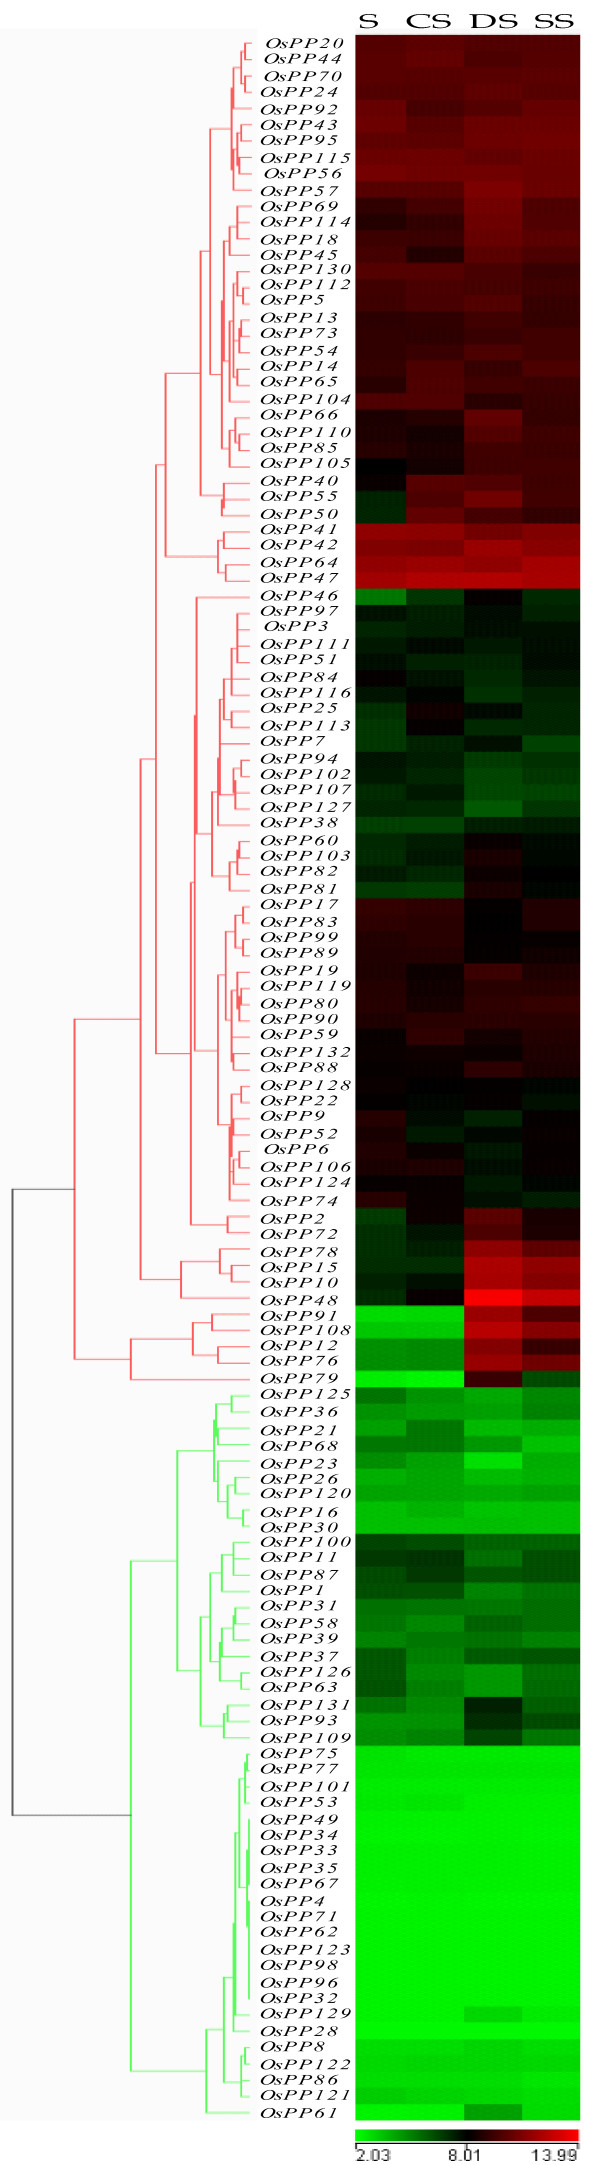
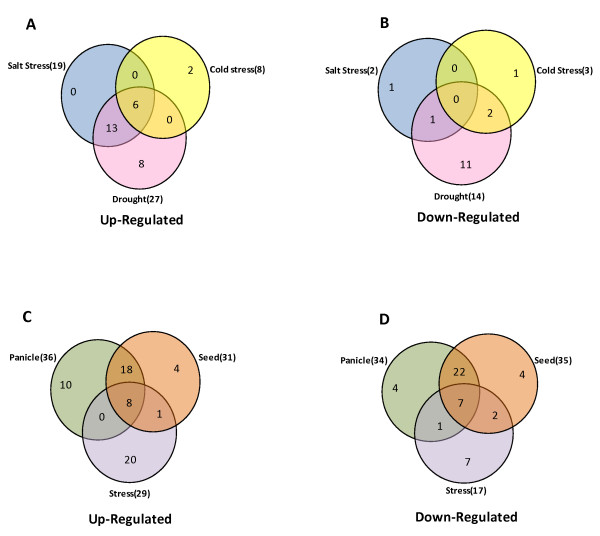
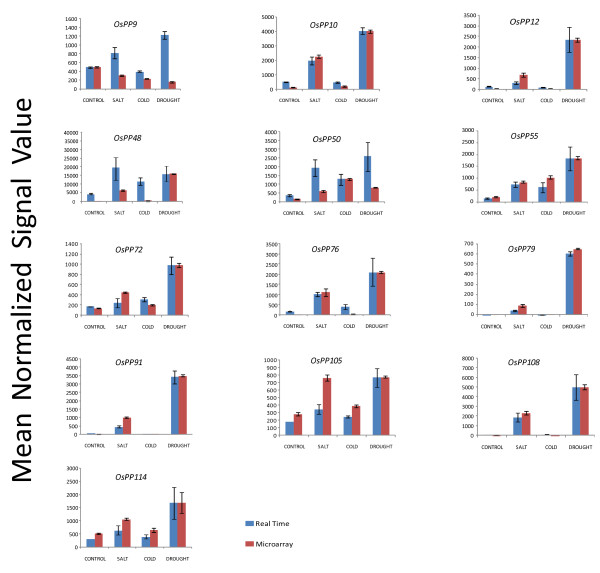
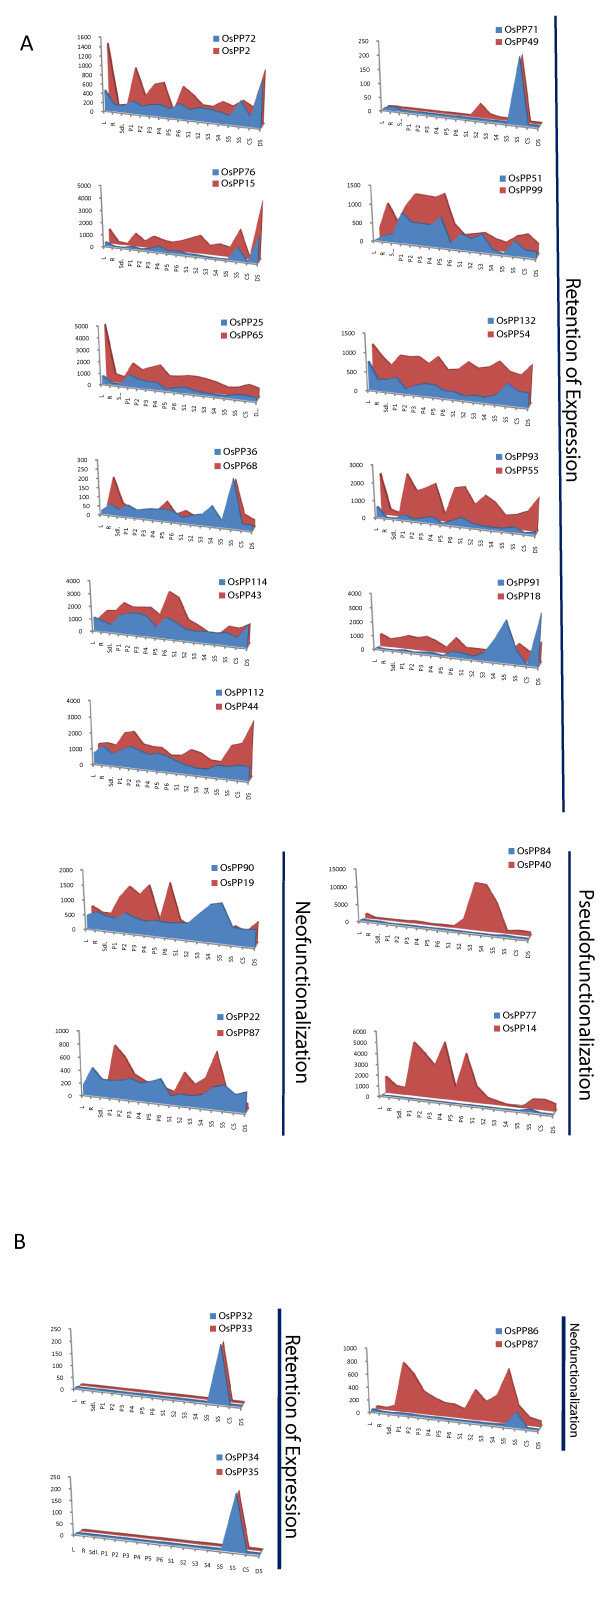
Results: In silico investigation revealed the presence of 132-protein phosphatase-coding genes in rice genome. Domain analysis and phylogenetic studies of evolutionary relationship categorized these genes into PP2A, PP2C, PTP, DSP and LMWP classes. PP2C class represents a major proportion of this gene family with 90 members. Chromosomal localization revealed their distribution on all the 12 chromosomes, with 42 genes being present on segmentally duplicated regions and 10 genes on tandemly duplicated regions of chromosomes. The expression profiles of 128 genes under salinity, cold and drought stress conditions, 11 reproductive developmental (panicle and seed) stages along with three stages of vegetative development were analyzed using microarray expression data. 46 genes were found to be differentially expressing in 3 abiotic stresses out of which 31 were up-regulated and 15 exhibited down-regulation. A total of 82 genes were found to be differentially expressing in different developmental stages. An overlapping expression pattern was found for abiotic stresses and reproductive development, wherein 8 genes were up-regulated and 7 down-regulated. Expression pattern of the 13 selected genes was validated employing real time PCR, and it was found to be in accordance with the microarray expression data for most of the genes.
Conclusions: Exploration of protein phosphatase gene family in rice has resulted in the identification of 132 members, which can be further divided into different classes phylogenetically. Expression profiling and analysis indicate the involvement of this large gene family in a number of signaling pathways triggered by abiotic stresses and their possible role in plant development. Our study will provide the platform from where; the expression pattern information can be transformed into molecular, cellular and biochemical characterization of members belonging to this gene family.
Figures


Similar articles
-
Maize protein phosphatase gene family: identification and molecular characterization.BMC Genomics. 2014 Sep 9;15(1):773. doi: 10.1186/1471-2164-15-773. BMC Genomics. 2014. PMID: 25199535 Free PMC article.
-
MADS-box gene family in rice: genome-wide identification, organization and expression profiling during reproductive development and stress.BMC Genomics. 2007 Jul 18;8:242. doi: 10.1186/1471-2164-8-242. BMC Genomics. 2007. PMID: 17640358 Free PMC article.
-
Rice phospholipase A superfamily: organization, phylogenetic and expression analysis during abiotic stresses and development.PLoS One. 2012;7(2):e30947. doi: 10.1371/journal.pone.0030947. Epub 2012 Feb 17. PLoS One. 2012. PMID: 22363522 Free PMC article.
-
Investigating how reproductive traits in rice respond to abiotic stress.J Exp Bot. 2025 May 27;76(8):2064-2080. doi: 10.1093/jxb/eraf031. J Exp Bot. 2025. PMID: 39876691 Free PMC article. Review.
-
Structural genomics of protein phosphatases.J Struct Funct Genomics. 2007 Sep;8(2-3):121-40. doi: 10.1007/s10969-007-9036-1. Epub 2007 Dec 5. J Struct Funct Genomics. 2007. PMID: 18058037 Free PMC article. Review.
Cited by
-
Rice NAC transcription factor ONAC095 plays opposite roles in drought and cold stress tolerance.BMC Plant Biol. 2016 Sep 20;16(1):203. doi: 10.1186/s12870-016-0897-y. BMC Plant Biol. 2016. PMID: 27646344 Free PMC article.
-
Molecular Characterization Reveals the Involvement of Calcium Dependent Protein Kinases in Abiotic Stress Signaling and Development in Chickpea (Cicer arietinum).Front Plant Sci. 2022 Apr 12;13:831265. doi: 10.3389/fpls.2022.831265. eCollection 2022. Front Plant Sci. 2022. PMID: 35498712 Free PMC article.
-
Importance of Tyrosine Phosphorylation in Hormone-Regulated Plant Growth and Development.Int J Mol Sci. 2022 Jun 13;23(12):6603. doi: 10.3390/ijms23126603. Int J Mol Sci. 2022. PMID: 35743047 Free PMC article. Review.
-
Comprehensive expression analysis of rice phospholipase D gene family during abiotic stresses and development.Plant Signal Behav. 2012 Jul;7(7):847-55. doi: 10.4161/psb.20385. Epub 2012 Jul 1. Plant Signal Behav. 2012. PMID: 22751320 Free PMC article.
-
"PP2C7s", Genes Most Highly Elaborated in Photosynthetic Organisms, Reveal the Bacterial Origin and Stepwise Evolution of PPM/PP2C Protein Phosphatases.PLoS One. 2015 Aug 4;10(8):e0132863. doi: 10.1371/journal.pone.0132863. eCollection 2015. PLoS One. 2015. PMID: 26241330 Free PMC article.
References
Publication types
MeSH terms
Substances
LinkOut - more resources
Full Text Sources
Other Literature Sources
Molecular Biology Databases
Miscellaneous
