. 2010 Jul 17:7:163.
doi: 10.1186/1743-422X-7-163.

The use of genomic signature distance between bacteriophages and their hosts displays evolutionary relationships and phage growth cycle determination

Affiliations

The use of genomic signature distance between bacteriophages and their hosts displays evolutionary relationships and phage growth cycle determination

Patrick Deschavanne et al. Virol J. .

Abstract

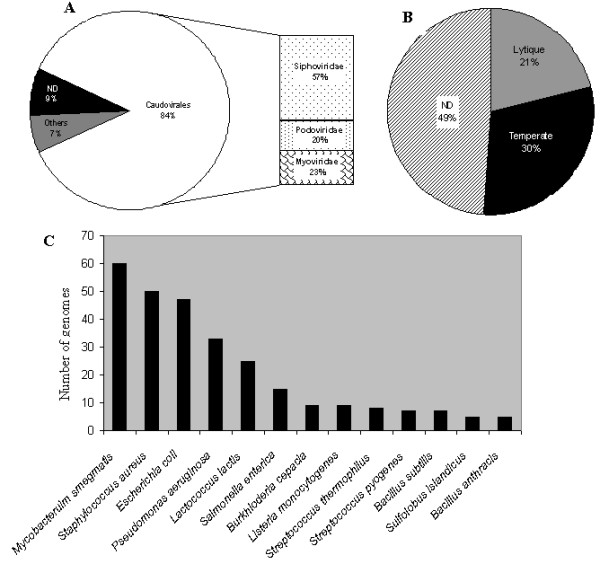
Background: Bacteriophage classification is mainly based on morphological traits and genome characteristics combined with host information and in some cases on phage growth lifestyle. A lack of molecular tools can impede more precise studies on phylogenetic relationships or even a taxonomic classification. The use of methods to analyze genome sequences without the requirement for homology has allowed advances in classification.

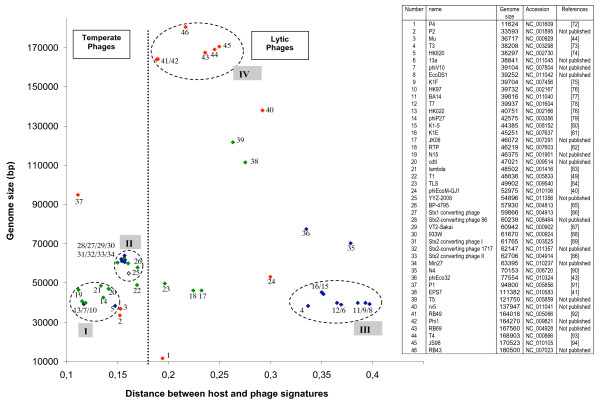
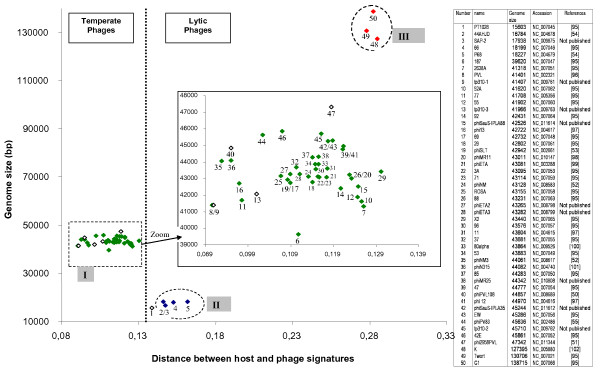
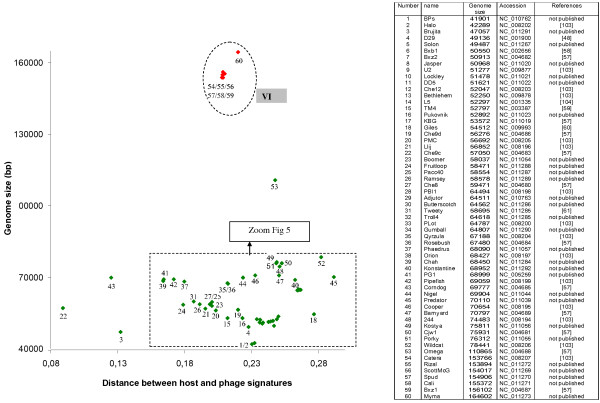
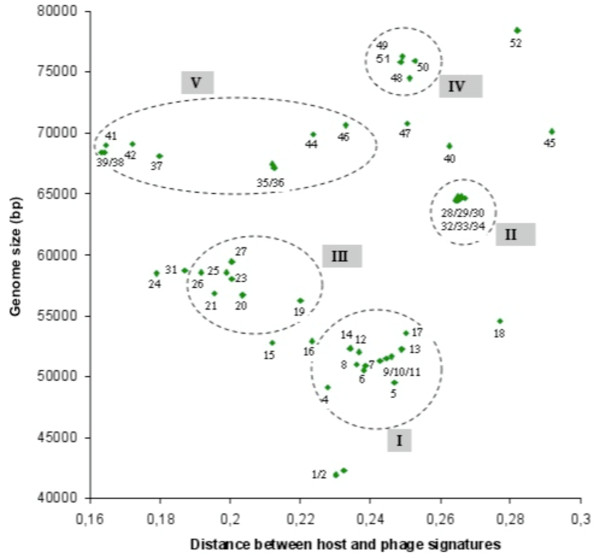
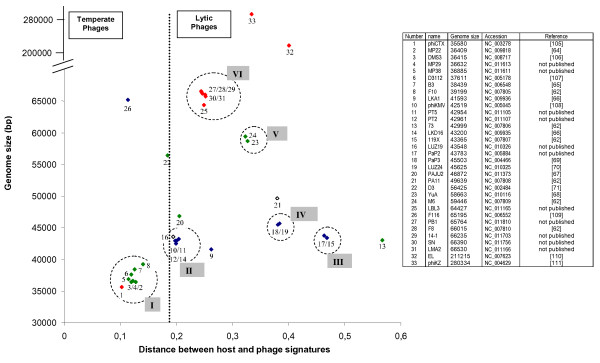
Results: Here, we proposed to use genome sequence signature to characterize bacteriophages and to compare them to their host genome signature in order to obtain host-phage relationships and information on their lifestyle. We analyze the host-phage relationships in the four most representative groups of Caudoviridae, the dsDNA group of phages. We demonstrate that the use of phage genomic signature and its comparison with that of the host allows a grouping of phages and is also able to predict the host-phage relationships (lytic vs. temperate).

Conclusions: We can thus condense, in relatively simple figures, this phage information dispersed over many publications.


Figures

Figure 1
Figure 1
Distribution of completely sequenced bacteriophage genomes retrieved from Genbank-phage Database. A: Proportion of genomes belonging to the different phage families. B: Proportion of genomes from temperate or lytic phages. C: Number of completely sequenced genome of phages infecting the same host. Only host with at least 5 different phages are shown. ND: Not indicated in the database.
Figure 2
Figure 2
Distribution of the genomic signature distances of E. coli phages as a function of size of phage genomes [72-94]. Red symbol: Myoviridae, green symbol: Siphoviridae, blue symbol Podoviridae, white symbol: family not indicated. The numbers correspond to the phages listed in the Table.
Figure 3
Figure 3
Distribution of the genomic signature distances of S. aureus phages as a function of size of phage genomes[95-102]. Red symbol: Myoviridae, green symbol: Siphoviridae, blue symbol Podoviridae, white symbol: family not indicated. The numbers correspond to the phages listed in the Table.
Figure 4
Figure 4
Distribution of the genomic signature distances of M. smegmatis phages as a function of size of phage genomes[103,104]. Red symbol: Myoviridae, green symbol: Siphoviridae, blue symbol Podoviridae, white symbol: family not indicated. The numbers correspond to the phages listed in the Table.
Figure 5
Figure 5
Zoom of Figure 4 allowing to visualize groups of genomes between 40 and 80 kb. Red symbol: Myoviridae, green symbol: Siphoviridae, blue symbol Podoviridae, white symbol: family not indicated. The numbers refer to the Table in Figure 4.
Figure 6
Figure 6
Distribution of the genomic signature distances of P. aeruginosa phages as a function of size of phage genomes [105-111]. Red symbol: Myoviridae, green symbol: Siphoviridae, blue symbol Podoviridae, white symbol: family not indicated. The numbers correspond to the phages listed in the Table. On the Y axis, a discontinuity was added to accommodate phages 32 and 33.

References

    1. Hatfull GF. Bacteriophage genomics. Curr Opin Microbiol. 2008;11(5):447–53. doi: 10.1016/j.mib.2008.09.004. - DOI - PMC - PubMed
    1. Whitman WB, Coleman DC, Wiebe WJ. Prokaryotes: the unseen majority. Proc Natl Acad Sci USA. 1998;95(12):6578–83. doi: 10.1073/pnas.95.12.6578. - DOI - PMC - PubMed
    1. Wommack KE, Colwell RR. Virioplankton: viruses in aquatic ecosystems. Microbiol Mol Biol Rev. 2000;64(1):69–114. doi: 10.1128/MMBR.64.1.69-114.2000. - DOI - PMC - PubMed
    1. Weinbauer MG. Ecology of prokaryotic viruses. FEMS Microbiol Rev. 2004;28(2):127–81. doi: 10.1016/j.femsre.2003.08.001. - DOI - PubMed
    1. Suttle CA. Marine viruses--major players in the global ecosystem. Nat Rev Microbiol. 2007;5(10):801–12. doi: 10.1038/nrmicro1750. - DOI - PubMed

LinkOut - more resources