. 2010 Aug 24;20(16):1438-44.
doi: 10.1016/j.cub.2010.06.021. Epub 2010 Jul 15.

An olfactory subsystem that detects carbon disulfide and mediates food-related social learning

Affiliations

An olfactory subsystem that detects carbon disulfide and mediates food-related social learning

Steven D Munger et al. Curr Biol. .

Abstract

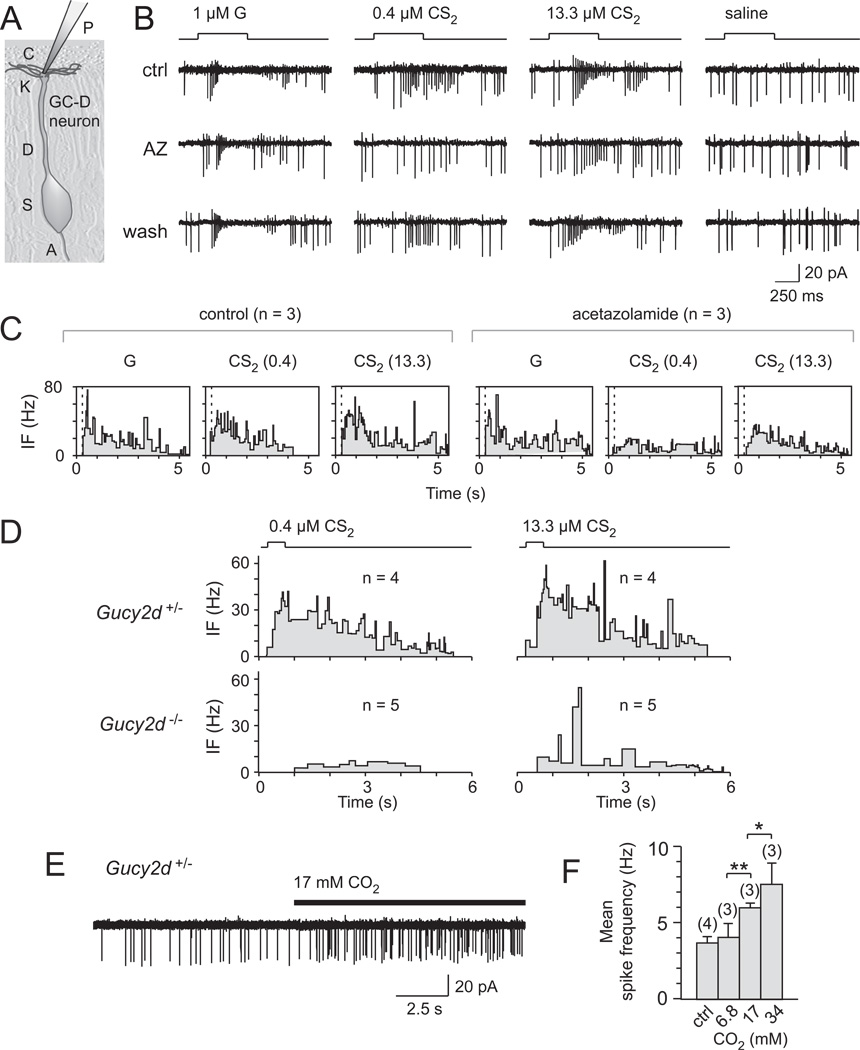
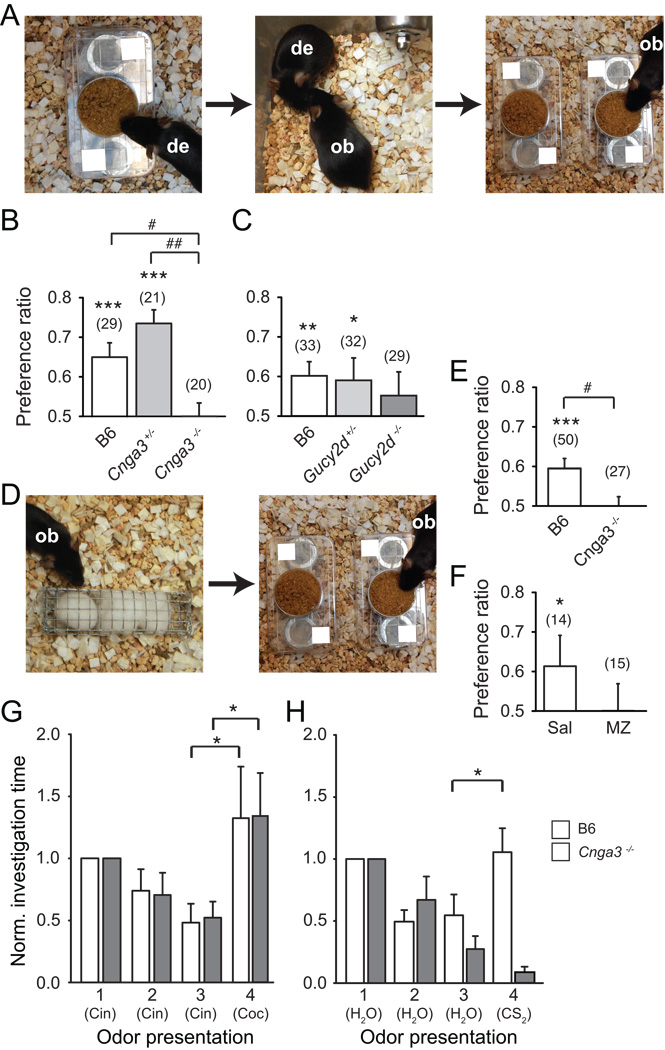
Olfactory signals influence social interactions in a variety of species. In mammals, pheromones and other social cues can promote mating or aggression behaviors; can communicate information about social hierarchies, genetic identity and health status; and can contribute to associative learning. However, the molecular, cellular, and neural mechanisms underlying many olfactory-mediated social interactions remain poorly understood. Here, we report that a specialized olfactory subsystem that includes olfactory sensory neurons (OSNs) expressing the receptor guanylyl cyclase GC-D, the cyclic nucleotide-gated channel subunit CNGA3, and the carbonic anhydrase isoform CAII (GC-D(+) OSNs) is required for the acquisition of socially transmitted food preferences (STFPs) in mice. Using electrophysiological recordings from gene-targeted mice, we show that GC-D(+) OSNs are highly sensitive to the volatile semiochemical carbon disulfide (CS(2)), a component of rodent breath and a known social signal mediating the acquisition of STFPs. Olfactory responses to CS(2) are drastically reduced in mice lacking GC-D, CNGA3, or CAII. Disruption of this sensory transduction cascade also results in a failure to acquire STFPs from either live or surrogate demonstrator mice or to exhibit hippocampal correlates of STFP retrieval. Our findings indicate that GC-D(+) OSNs detect chemosignals that facilitate food-related social interactions.


Figures

Figure 1
Figure 1
MOE responses to sub-micromolar concentrations of CS2 require signaling components expressed in GC-D+ OSNs. (A) Schematic illustrating several key regions of the mouse olfactory system. GG, Grueneberg ganglion; VNO, vomeronasal organ (apical and basal regions); MOE, main olfactory epithelium; MOB, main olfactory bulb; NG, necklace glomeruli (blue spheres); AOB, accessory olfactory bulb (anterior and posterior regions). Blowout is a confocal micrograph showing a single GC-D+ OSN (white, labeled with antisera to PDE2) in the MOE amongst numerous DAPI (blue)-stained nuclei of other neurons, supporting cells and progenitor cells. See Figure 2A for schematic of an OSN. Scale bar, 20 µm. (B) Examples of local field potentials generated in the MOE of C57BL/6J (B6), Gucy2d−/−, Car2n or Cnga3−/− mice, with 500-ms pulses of 1 µM guanylin (G), 1 µM uroguanylin (UG), 0.4 µM CS2 or 13.3 µM CS2. (C) Mean EOG responses to different concentrations of CS2 from MOE of B6, Gucy2d+/−, Gucy2d−/−, Car2n or Cnga3−/− mice (n ≥ 3 each). LSD: *p < 0.05, **p < 0.01, ***p < 0.0001; ns, not significant. Responses were concentration dependent (ANOVA: F = 25.47, p < 0.0001). Number of independent recordings in parentheses. Data are expressed as means ± s.e.m. (D) Mean EOG responses to G or UG (1 µM each) from MOE of B6, Gucy2d+/−, Gucy2d−/−, Car2n or Cnga3−/− mice (n ≥ 3 each). Responses to G and UG were indistinguishable from each other in Gucy2d+/− and Car2n mice (LSD: p = 0.09 – 0.96) but absent in Gucy2d−/− and Cnga3−/− mice (LSD: p < 0.0001). Number of independent recordings in parentheses. Data are expressed as means ± s.e.m. (E) Slice preparation of Grueneberg ganglion [41] from Omp-EGFP mouse showing sensory cells (green). Scale bar, 25 µm. (F) Ca2+ response of a single Grueneberg ganglion cell to 1 mM CS2 and 60 mM KCl. Responses are representative of the analysis of eight Grueneberg ganglion slices, each from a different Omp-EGFP mouse.
Figure 2
Figure 2
GC-D+ OSNs are highly sensitive CS2 detectors. (A) Schematic of patch clamp recording from dendritic knobs of identified (i.e., β-galactosidase-expressing) GC-D+ OSNs. P, patch electrode; C, cilia; K, knob; D, dendrite; S, soma; A, axon. (B) Stimulus-evoked discharges recorded from an individual dendritic knob of a ®-gal-expressing OSN of Gucy2d+/− mice (continuous recording) in response to guanylin (G, 1 ⎧M), CS2 (0.4 ⎧M or 13.3 ⎧M), or saline before, during or after treatment with 1 mM acetazolamide (AZ; n=3). CS2 produced a profound, concentration-dependent excitation in these cells (ANOVA: F = 13.4, p = 0.002). (C) Mean instantaneous firing frequencies before (area under the curve (AUC): guanylin, 73.5 ± 4.9 Hz·s; 0.4 µM CS2, 83.2 ± 5.2 Hz·s; 13.3 µM CS2, 100.8 ± 3.0 Hz·s) or after AZ treatment (AUC: guanylin, 83.8 ± 10.0 Hz·s; 0.4 µM CS2, 56.7 ± 6.1 Hz·s; 13.3 µM CS2, 74.8 ± 1.3 Hz·s). The CS2 response magnitude was significantly reduced after AZ treatment (guanylin: LSD: P=0.05; CS2: LSD: P < 0.0001). (D) Mean instantaneous firing frequencies of CS2-dependent action potentials in β-gal-expressing OSNs of Gucy2d+/− (AUC: 0.4 µM CS2, 70.8 ± 10.8 Hz·s; 13.3 µM CS2, 94.4 ± 18.5 Hz·s) and Gucy2d−/− mice (AUC: 0.4 µM CS2, 16.3 ± 4.1 Hz·s; 13.3 µM CS2, 35.8 ± 14.8 Hz·s; LSD: P < 0.0001). No increase in firing frequency was observed upon stimulation with 0.4 µM CS2 in Gucy2d−/− mice (LSD: p = 0.76). Number of cells indicated in the figure. (E) Stimulus-evoked discharges recorded from dendritic knob of β-gal-expressing OSN from a Gucy2d+/− mouse in response to 17.4 mM CO2. (F) Mean spike frequency in response to CO2 stimulation of β-gal-expressing OSNs from Gucy2d+/− mice. Number of independent recordings in parentheses. Experiments were performed in at least three mice. Data are expressed as means ± SD. LSD: *p ≤ 0.05, **p < 0.01.
Figure 3
Figure 3
Mice deficient in GC-D+ OSN-mediated CS2 responses fail to acquire socially transmitted food preferences. (A) In the STFP bioassay, a live demonstrator mouse (de) eats odored food (left) and is then exposed to one or more observer mice (ob; middle). Each observer mouse is then given a choice of food with the demonstrated odor or a novel odor (right). (B) Preference ratios (PR) for B6, Cnga3+/− and Cnga3−/− mice in the STFP bioassay. [PR: demonstrated food consumed (g) / total food consumed (g); PR of 0.50 indicates no preference]. PR (B6) = 0.65 ± 0.04; PR (Cnga3+/−) = 0.74 ± 0.03; PR (Cnga3−/−) = 0.50 ± 0.03; Z test: z (B6) = 4.18, p < 0.0001; z (Cnga3+/−) = 6.84, p < 0.0001; z (Cnga3−/−) = 0.03, p = 0.49. ***, p < 0.0001 (z score); #, p < 0.05 (Mann Whitney U). Parentheses, number of mice. (C) Preference ratios for B6, Gucy2d+/− and Gucy2d−/− mice in the STFP bioassay. PR (B6) = 0.60 ± 0.04; PR (Gucy2d+/−) = 0.59 ± 0.06; PR (Gucy2d−/−) = 0.55 ± 0.06; z (B6) = 2.84, p = 0.003; z (Gucy2d+/−) = 1.6, p = 0.05; z (Gucy2d−/−) = 0.87; p = 0.19. **, p < 0.01, *, p < 0.05 (z score). Parentheses, number of mice. (D) In the CS2 bioassay, a live observer mouse (ob) is exposed to a surrogate demonstrator treated with 1 ppm (13 µM) CS2 and a food odor (left). Each observer mouse is then given a choice of food with the demonstrated odor or a novel odor (right). (E) Preference ratios for B6 and Cnga3−/− mice in the CS2 bioassay. PR (B6) = 0.59 ± 0.02; z = 3.7, p = 0.001; PR (Cnga3−/−) = 0.50 ± 0.02; z = -0.08, p = 0.47. ***p < 0.001 (z score); #, p < 0.05 (Mann Whitney U). Parentheses, number of mice. (F) Preference ratios of B6 mice treated with intranasal application of saline or methazolamide (MZ). PR (MZ) = 0.49 ± 0.07; z = 0.95, p = 0.17; PR (saline) = 0.61 ± 0.08; z = 1.68, p = 0.05. *, p < 0.05 (z score). (G) Performance of B6 (white) and Cnga3−/− (gray) mice in an olfactory habituation/dishabituation task with two food odors. Numbers indicate odor presentation order. Cin, cinnamon (1% in water); Coc, cocoa (2% in water). One-way repeated measures ANOVA: F = 3.20, p = 0.04 (B6); F = 4.2, p = 0.01 (Cnga3−/−); *, p < 0.05 (SNK post-hoc). (H) Performance of B6 and Cnga3−/− mice (gray) in an olfactory habituation/dishabituation task with water and 13 µM CS2. Numbers indicate odor presentation order. One-way repeated measures ANOVA: F = 2.33, p = 0.004 (B6); F = 2.97, p < 0.001 (Cnga3−/−); *, p < 0.05 (SNK post-hoc).
Figure 4
Figure 4
CNS correlate of food preference learning is absent in Cnga3−/− mice. (A) Schematic of the mouse brain (one hemisphere, coronal section) indicating areas of ventral subiculum (magenta box), dorsal subiculum (yellow box) and entorhinal cortex (green box) analyzed for c-Fos immunoreactivity in H-K. (B) Representative c-Fos immunohistochemistry in hippocampus ventral subiculum of B6 (top) and Cnga3−/− (bottom) observer mice demonstrated an irrelevant (ginger, left) or relevant (cinnamon, right) odor. All mice were then given a choice of cocoa- or cinnamon-flavored food. Scale bar, 100 um. See Figure S2 in Supplementary data for representative images of dorsal subiculum and entorhinal cortex. (C−E) Mean counts (per mm2) of c-Fos immunoreactive (c-Fos +) cells in ventral subiculum (I), dorsal subiculum (J) and entorhinal cortex (K) of B6 (white; n=6) and Cnga3−/− (gray; n=5) mice demonstrated ginger or cinnamon odors. Two-way ANOVAs revealed no significant effects of genotype or demonstrated odor for either dorsal subiculum (F = 0.580; p = 0.635) or entorhinal cortex (F = 0.624; p = 0.609). There was a significant effect of genotype in ventral subiculum (F = 6.74; p = 0.002). SNK post-hoc tests revealed significant differences between B6 mice demonstrated cinnamon vs. ginger (*, p = 0.05) and between B6 and Cnga3−/− mice demonstrated cinnamon (*, p = 0.02) but not ginger (p = 0.34). (F) Summary schematic. Food odors activate subsets of canonical OSNs in the MOE, while CS2 stimulates GC-D+ OSNs. Afferent information from these two olfactory subsystems is integrated in the olfactory CNS, perhaps as early as the necklace glomeruli in the MOB. An association is formed, which is manifest as a preference for the food paired with CS2.

References

    1. Brennan PA, Zufall F. Pheromonal communication in vertebrates. Nature. 2006;444:308–315. - PubMed
    1. Cheal ML, Sprott RL. Social olfaction: a review of the role of olfaction in a variety of animal behaviors. Psychol Rep. 1971;29:195–243. - PubMed
    1. Restrepo D, Lin W, Salcedo E, Yamazaki K, Beauchamp G. Odortypes and MHC peptides: Complementary chemosignals of MHC haplotype? Trends Neurosci. 2006;29:604–609. - PubMed
    1. Kavaliers M, Choleris E, Pfaff DW. Genes, odours and the recognition of parasitized individuals by rodents. Trends Parasitol. 2005;21:423–429. - PubMed
    1. Leon M. The neurobiology of filial learning. Annu Rev Psychol. 1992;43:377–398. - PubMed

Publication types

MeSH terms