. 2011 Jan;60(1):108-15.
doi: 10.1016/j.neuropharm.2010.07.009. Epub 2010 Jul 15.

Structure based prediction of subtype-selectivity for adenosine receptor antagonists

Affiliations

Structure based prediction of subtype-selectivity for adenosine receptor antagonists

Vsevolod Katritch et al. Neuropharmacology. 2011 Jan.

Abstract

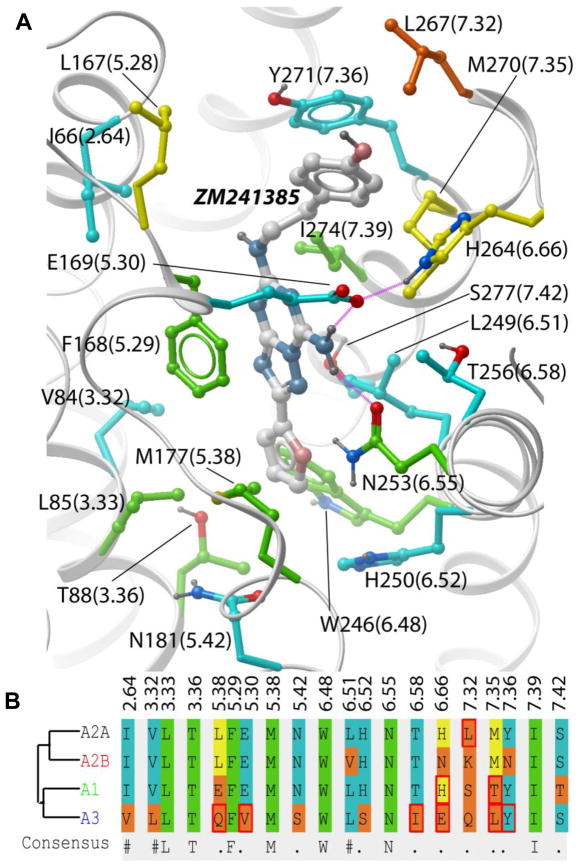
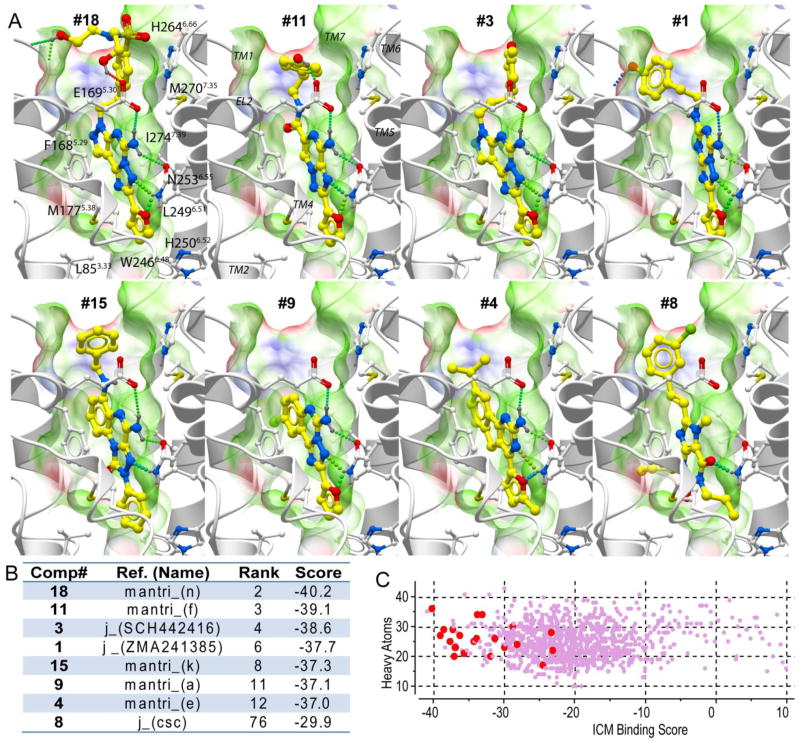
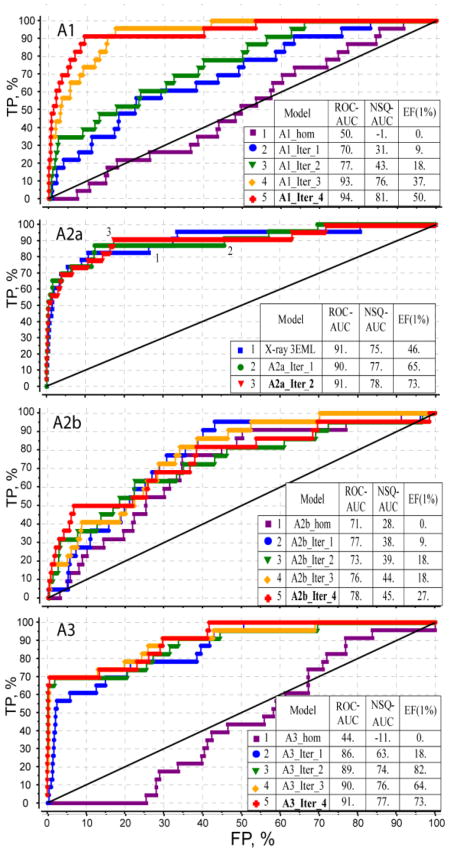
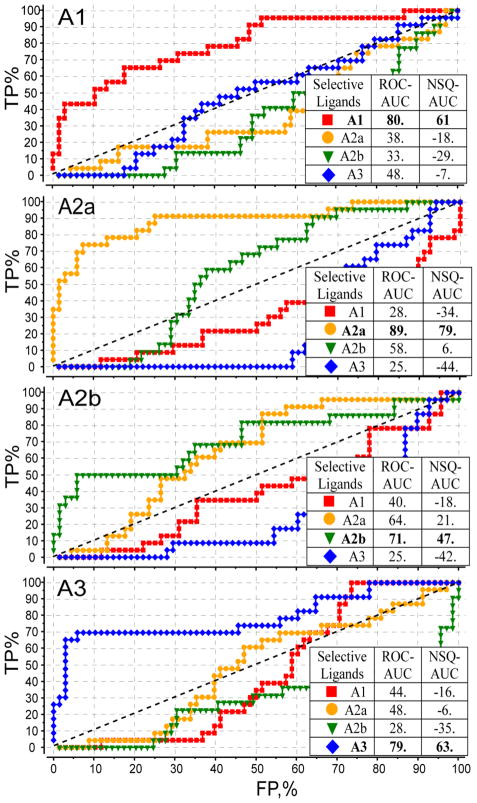
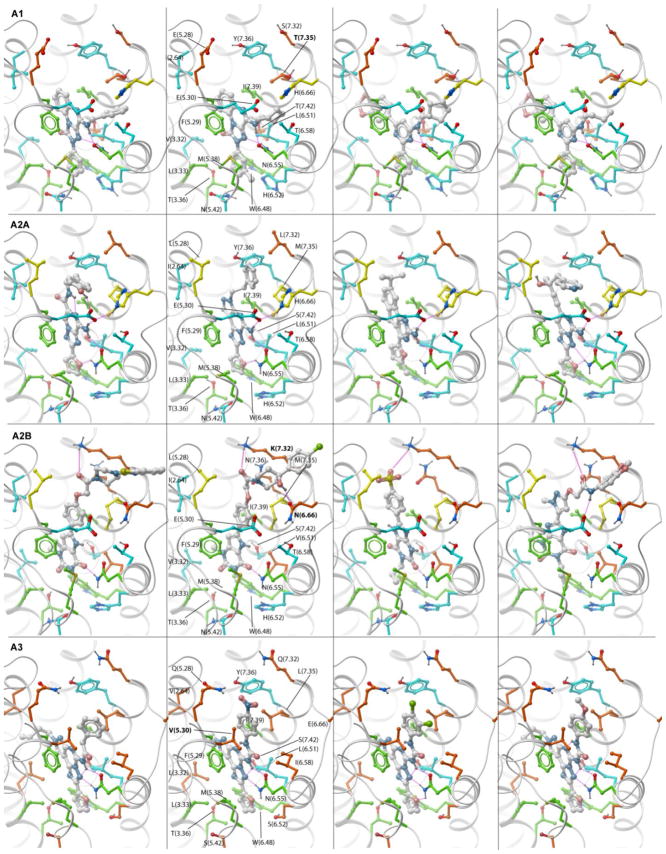
One of the major hurdles in the development of safe and effective drugs targeting G-protein coupled receptors (GPCRs) is finding ligands that are highly selective for a specific receptor subtype. Structural understanding of subtype-specific binding pocket variations and ligand-receptor interactions may greatly facilitate design of selective ligands. To gain insights into the structural basis of ligand subtype selectivity within the family of adenosine receptors (AR: A(1), A(2A), A(2B), and A(3)) we generated 3D models of all four subtypes using the recently determined crystal structure of the A(A2)AR as a template, and employing the methodology of ligand-guided receptor optimization for refinement. This approach produced 3D conformational models of AR subtypes that effectively explain binding modes and subtype selectivity for a diverse set of known AR antagonists. Analysis of the subtype-specific ligand-receptor interactions allowed identification of the major determinants of ligand selectivity, which may facilitate discovery of more efficient drug candidates.


Figures

Figure 1
Figure 1
Residue variations in the ligand binding pocket between four human adenosine receptor subtypes. (A) In the 3D structure of the AA2AR binding pocket, residue numbers are shown for AA2 subtype (number in brackets as in ref, based on Ballesteros-Weinstein GPCR numbering). Side chain carbons are colored according to their conservation: green – fully identical in all 4 subtypes, cyan – in 3 subtypes, yellow – in 2 subtypes, orange - in only one subtype. Binding pocket residue alignment (B) uses the same color coding. Residues that vary between clinically relevant species (human, rat, mouse, dog) in the same subtype are marked with a red box.
Figure 2
Figure 2
Virtual screening with a crystal structure of adenosine A2A receptor. A) Examples of the binding modes for the top seven ranked ligands (in order of their ranking), as well as for the top ranked xanthine-based compound 8. Ligands are shown with yellow carbon atoms, while receptor side chains carbons are white. Ligand-receptor hydrogen bonds are indicated by green spheres. The A2AAR binding pocket is illustrated by molecular skin colored by properties (green – hydrophobic, red and blue – hydrogen bond acceptor and donor respectively). (B) Binding Scores and ranking for these compounds. C) Scatter plot of ICM binding scores for the whole benchmark set, with the experimentally validated ligands shown by larger red dots and decoys with small purple dots. The Y axis shows distribution of compound size as a number of heavy atoms.
Figure 3
Figure 3
Ligand guided optimization of AR subtype models. Progression of VLS selectivity from an initial homology model through four iterations of the procedure is shown for each of the AR subtypes (only 2 iterations for A2AAR model). Tables show three different metrics of VLS performance of the models: linear ROC_AUC, normalized square root NSQ_AUC and enrichment factor at 1% dataset cutoff, EF(1%).
Figure 4
Figure 4
Selectivity profiles for all four AR subtypes. Each ROC curve represents performance of an optimized conformation model of an AR subtype in discriminating subtype-selective antagonists from all other AR antagonists in the set. Tables show linear ROC_AUC and normalized square root NSQ_AUC for each of the curves, with results for each matching model-ligand subset shown in bold font.
Figure 5
Figure 5
Predicted binding modes of subtype-specific antagonists in the corresponding optimized models of the AR subtypes. Residues critical for subtype selectivity are labeled in bold font. Side chain carbons are colored as in Figure 1. PDB files for all optimized models in complex with antagonists can be found in Supplementary Materials.

References

    1. Tyndall JD, Sandilya R. GPCR agonists and antagonists in the clinic. Med Chem. 2005;1:405–421. - PubMed
    1. Lagerstrom MC, Schioth HB. Structural diversity of G protein-coupled receptors and significance for drug discovery. Nat Rev Drug Discov. 2008;7:339–357. - PubMed
    1. Jacobson KA. Introduction to adenosine receptors as therapeutic targets. Handb Exp Pharmacol. 2009:1–24. - PMC - PubMed
    1. Morelli M, Carta AR, Jenner P. Adenosine A(2A) Receptors and Parkinson’s Disease. Handb Exp Pharmacol. 2009:589–615. - PubMed
    1. Sebastiao AM, Ribeiro JA. Adenosine receptors and the central nervous system. Handb Exp Pharmacol. 2009:471–534. - PubMed

Publication types