. 2010 Sep 15;50(19):1989-99.
doi: 10.1016/j.visres.2010.07.009. Epub 2010 Jul 16.

Deletion of the X-linked opsin gene array locus control region (LCR) results in disruption of the cone mosaic

Affiliations

Deletion of the X-linked opsin gene array locus control region (LCR) results in disruption of the cone mosaic

Joseph Carroll et al. Vision Res. .

Abstract

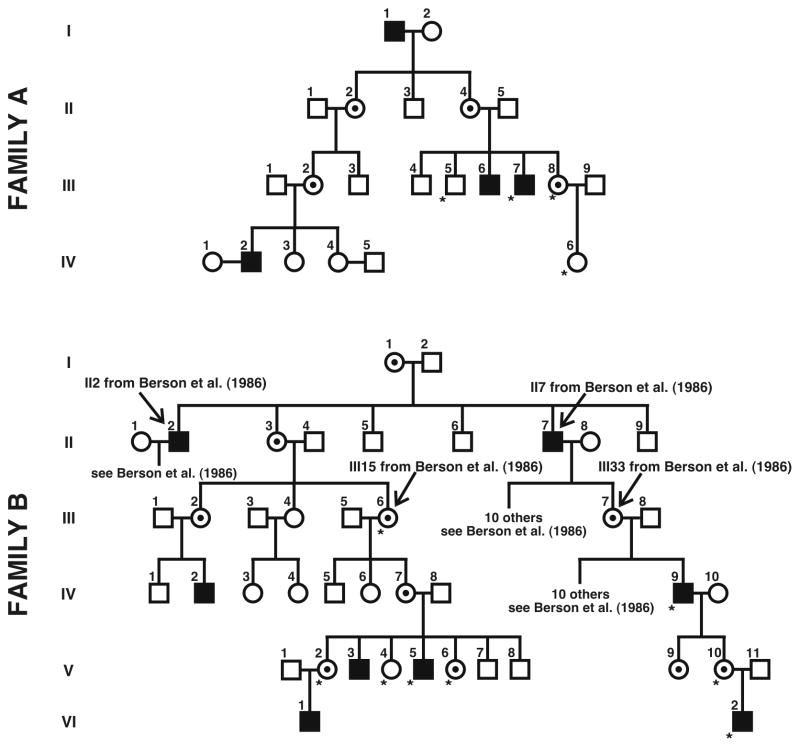
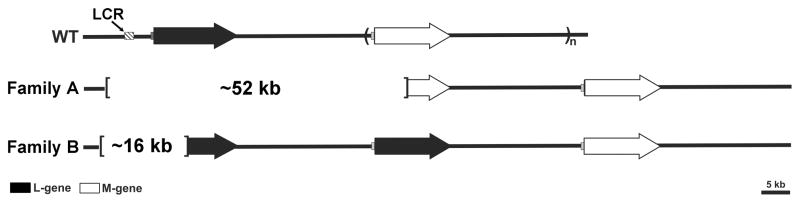
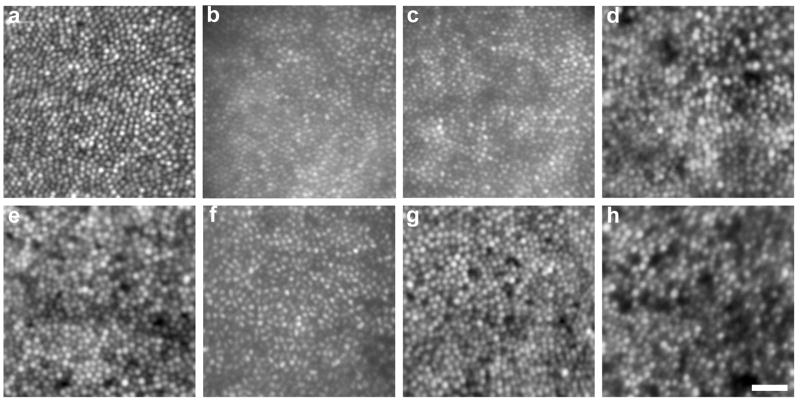
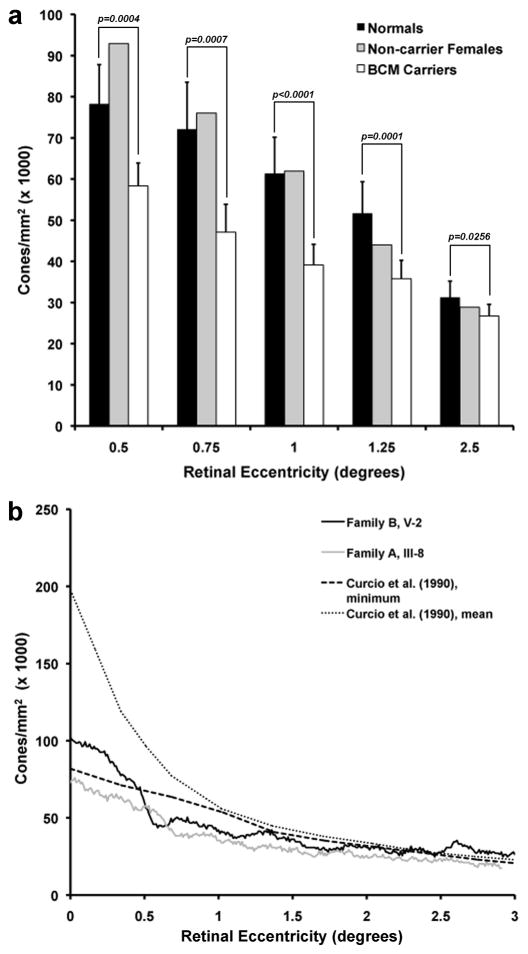
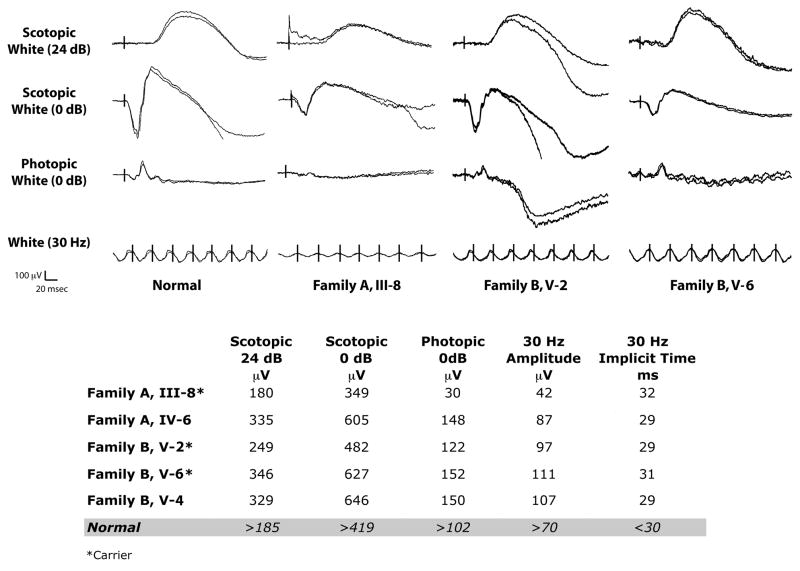
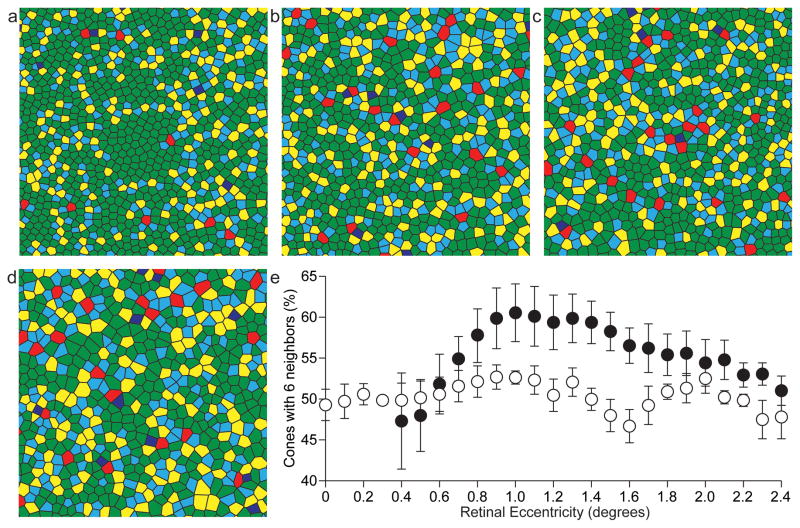
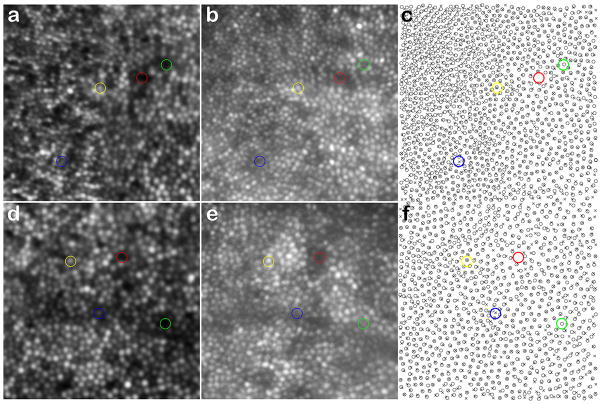
Blue cone monochromacy (BCM) is an X-linked condition in which long- (L) and middle- (M) wavelength-sensitive cone function is absent. Due to the X-linked nature of the condition, female carriers are spared from a full manifestation of the associated defects but can show visual symptoms, including abnormal cone electroretinograms. Here we imaged the cone mosaic in four females carrying an L/M array with deletion of the locus control region, resulting in an absence of L/M opsin gene expression (effectively acting as a cone opsin knockout). On average, they had cone mosaics with reduced density and disrupted organization compared to normal trichromats. This suggests that the absence of opsin in a subset of cones results in their early degeneration, with X-inactivation the likely mechanism underlying phenotypic variability in BCM carriers.


Figures

Figure 1
Figure 1
BCM pedigrees showing X-linked recessive inheritance. Filled squares are affected males by history; circles with central dot are female carriers (obligate or genetically determined). Open circles and squares represent unaffected females and males, respectively. Asterisks represent subjects for whom genetic analyses were completed. Adaptive optics images were acquired from subjects III-8 and IV-6 in Family A, and IV-7, V-2, V-4, and V-6 in Family B. Family B was determined to be one of the families reported by Berson et al. (1986); known links between the two pedigrees are indicated.
Figure 2
Figure 2
Diagram of BCM genotypes found in this study. Each arrow represents an L or M gene. The L and M genes reside in a head-to-tail tandem array, which is variable in gene number. The most common configuration among individuals with normal color vision is to have 1 L gene (filled arrows) followed by 1 or more M genes (open arrows). Each L or M gene is preceded by a proximal promoter (shaded gray boxes) and the entire array has a single locus control region (LCR) that is essential for the expression of genes from the array (hatched box). The deletion in Family A was about 52 kb in length, and included the LCR, the entire first gene in the array, and part of the second gene in the array. The deletion in Family B was about 16 kb in length, and included the LCR and part of the first gene in the array.
Figure 3
Figure 3
Appearance of the cone mosaic in carriers of BCM. Each image is 0.5 degree × 0.5 degree, centered approximately 1 degree from the center of fixation. (a) Normal trichromat control, (b) Non-carrier (Family A, IV-6), (c) Non-carrier (Family B, V-4), (d) BCM carrier (Family A, III-8), (e) BCM carrier (Family B, V-2), (f) BCM carrier (Family B, V-6), (g) BCM carrier (Family B, IV-7, left eye), and (h) BCM carrier (Family B, IV-7, right eye). Scale bar is 0.5 arcminutes.
Figure 4
Figure 4
Cone density as a function of retinal eccentricity. (A) Cone density was averaged for between eight and 14 normals (dark filled bars) and all four BCM carriers (open bars). Error bars indicate +1 SD. Cone density for the two non-carrier females (Family A, IV-6 and Family B, V-4) is also shown (gray bars). (B) Cone density along the temporal meridian for the BCM carriers with the minimum (Family A, III-8) and maximum (Family B, V-2) foveal cone density. Plotted for comparison is the minimum and mean normal cone density from Curcio et al. (1990).
Figure 5
Figure 5
Reduced cone function in BCM Carriers. Shown are electroretinograms from 3 of the BCM carriers and a normal control. Both rod and cone responses appear reduced in the carriers compared to the non-carriers, though this is variable. Normal values are specific to the instrument used to collect the clinical ERG data, and there is substantial normal variation.
Figure 6
Figure 6
Disrupted regularity of the cone mosaic in the BCM carrier retina. Voronoi diagrams for a normal control (a) and BCM carriers Family B, IV-7 (b), Family B, V-2 (c), and Family A, III-8 (d). Voronoi patch color corresponds to the number of neighbors of each cone, where blue, cyan, green, yellow, and red polygons correspond to cones having, ≤4, 5, 6, 7, or ≥8 neighbors, respectively. (e) Mean percentage of cones having six neighbors, averaged at 0.1 degree intervals, for the BCM carriers (open symbols) and 6 normal controls (filled symbols). Measurements for normal eyes within 0.3 degrees from the PRLF are excluded due to the lack of sufficient data from normal subjects in that area. For the normal eyes, data from five eyes is averaged at the 0.4° location while six eyes are averaged elsewhere. For the BCM carrier eyes, four eyes are averaged between 0° and 1.4° and three eyes elsewhere.
Figure 7
Figure 7
Comparison of retinal images from different AO imaging systems. Shown is a comparison of the same patch of retina from subject V-2 (Family B) imaged nearly 2 years apart on the AOSLO (a, d) and the AO flood-illuminated camera (b, e). (c, f) Cone coordinates obtained from an automated cone identification algorithm, where crosses are cone centers from the AOSLO image, and open circles are cone centers from the AO flood-illuminated system. Red circles indicate positions where no cone was visible in either image, yellow circles indicate positions where a cone was visible in both images, blue circles indicate positions where a cone was visible on the AOSLO image, but not the AO flood-illuminated image, and green circles indicate positions where a cone was visible on the AO flood-illuminated image, but not the AOSLO image. Images a & b are from about 0.5 degree temporal from fixation, while d & e are from about 1.0 degree temporal from fixation.

References

    1. Ayyagari R, Kakuk LE, Bingham EL, Szczesny JJ, Kemp JA, Toda Y, Felius J, Sieving PA. Spectrum of color gene deletions and phenotype in patients with blue cone monochromacy. Human Genetics. 2000;107:75–82. - PubMed
    1. Ayyagari R, Kakuk LE, Coats CL, Bingham EL, Toda Y, Felius J, Sieving PA. Bilateral macular atrophy in blue cone monochromacy (BCM) with loss of the locus control region (LCR) and part of the red pigment gene. Molecular Vision. 1999a;5:13–18. - PubMed
    1. Ayyagari R, Kakuk LE, Toda Y, Coats CL, Bingham EL, Szczesny JJ, Felius J, Sieving PA. Blue cone monochromacy: Macular degeneration in individuals with cone specific gene loss. In: Hollyfield JG, Anderson RE, LaVail MM, editors. Retinal Degenerative Diseases and Experimental Therapy. New York: Kluwer Academic/Plenum Publishers; 1999b.
    1. Baraas RC, Carroll J, Gunther KL, Chung M, Williams DR, Foster DH, Neitz M. Adaptive optics retinal imaging reveals S-cone dystrophy in tritan color-vision deficiency. Journal of the Optical Society of America A. 2007;24(5):1438–1446. - PMC - PubMed
    1. Berson EL, Sandberg MA, Maguire A, Bromley WC, Roderick TH. Electroretinograms in carriers of blue cone monochromatism. American Journal of Ophthalmology. 1986;102(2):254–261. - PubMed

Publication types