Comparative Study
. 2010 Oct;89(10):1135-41.
doi: 10.1177/0022034510373764. Epub 2010 Jul 16.

Cytokine expression and accelerated tooth movement

Affiliations
Comparative Study

Cytokine expression and accelerated tooth movement

C C Teixeira et al. J Dent Res. 2010 Oct.

Abstract

It has been shown that inhibiting the expression of certain cytokines decreases the rate of tooth movement. Here, we hypothesized that stimulating the expression of inflammatory cytokines, through small perforations of cortical bone, increases the rate of bone remodeling and tooth movement. Forty-eight rats were divided into 4 groups: 50-cN force applied to the maxillary first molar (O), force application plus soft tissue flap (OF), force application plus flap plus 3 small perforations of the cortical plate (OFP), and a control group (C). From the 92 cytokines studied, the expression of 37 cytokines increased significantly in all experimental groups, with 21 cytokines showing the highest levels in the OFP group. After 28 days, micro-computed tomography, light and fluorescent microscopy, and immunohistochemistry demonstrated higher numbers of osteoclasts and bone remodeling activity in the OFP group, accompanied by generalized osteoporosity and increased rate of tooth movement.


Figures
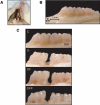
Figure 1.
Figure 1.
Osteoperforations increase the rate of tooth movement. (A) Photograph of experimental model. (B) Schematic showing the 3 shallow perforations (0.25 mm diameter and depth) created, 5 mm mesial to the first molar. (C) Representative photographs of rat maxillae showing movement of left first molar at 28 days in the 4 groups. C = control; O = orthodontic force alone; OF = orthodontic force plus flap; OFP = orthodontic force plus flap plus perforations.
Figure 2.
Figure 2.
Osteoperforations increased expression of inflammatory markers. Mean “-fold” increase in expression of cytokines (A), chemokines (B), and inflammatory receptors (C) in the orthodontic group (O, white bars) and the orthodontic force plus flap plus perforations group (OFP, black bars) compared with controls. Data expressed as mean ± SE of 3 experiments. All values in the orthodontic (O) group showed a statistically significant increase from controls. *Significantly different from orthodontic (O) group, p < 0.05.
Figure 3.
Figure 3.
Osteoperforations increased osteoclast activity. (A) Light microphotographs of H&E-stained section (top row) show differences in PDL thickness (p) and alveolar bone resorption (b) in the area of the mesio-palatal root of the maxillary first molar 28 days post-treatment. TRAP-positive immunohistochemical staining reveals osteoclasts as brown cells (arrowheads) on the mesial alveolar bone surface in the area of the mesio-palatal root of the maxillary first molar (bottom row). (B) High-magnification view of TRAP-positive osteoclast. (C) Changes in number of TRAP-positive cells on the mesial alveolar bone surface of the mesio-palatal root of the maxillary first molar. Each value represents the mean ± SEM of 4 samples. *Significantly different from C group. **Significantly different from C, O, and OF groups; p < 0.05.
Figure 4.
Figure 4.
Osteoperforations increased bone remodeling rates and generalized osteoporosity in the entire length of the hemimaxillae. (A) Sagittal sections of maxillae from the 4 groups viewed under fluorescent microscopy showed the rate of bone remodeling in the entire hemimaxillae. The increased intensity of the label in most of the trabecular surface of the OFP group in comparison with other groups indicates that extensive bone remodeling has taken place at 28 days post-treatment. White arrows demonstrate the direction of force application. (B) Schematic indicating axial sections (1, 2, 3) and coronal sections (a, b, c) used in the analysis. (C) Representative coronal sections obtained by microCT analysis showing increased trabecular spacing in the OFP group, indicative of bone remodeling activity. White arrows demonstrate the direction of force application. C = control; O = orthodontic force alone; OF = orthodontic force plus flap; OFP = orthodontic force plus flap plus perforations.

References

    1. Adachi Y, Okazaki M, Ohno N, Yadomae T. (1994). Enhancement of cytokine production by macrophages stimulated with (1-->3)-beta-D-glucan, grifolan (GRN), isolated from Grifola frondosa. Biol Pharm Bull 17:1554-1560 - PubMed
    1. Alhashimi N, Frithiof L, Brudvik P, Bakhiet M. (2000). Orthodontic movement induces high numbers of cells expressing IFN-gamma at mRNA and protein levels. J Interferon Cytokine Res 20:7-12 - PubMed
    1. Arend WP, Palmer G, Gabay C. (2008). IL-1, IL-18, and IL-33 families of cytokines. Immunol Rev 223:20-38 - PubMed
    1. Arias OR, Marquez-Orozco MC. (2006). Aspirin, acetaminophen, and ibuprofen: their effects on orthodontic tooth movement. Am J Orthod Dentofacial Orthop 130:364-370 - PubMed
    1. Başaran G, Ozer T, Kaya FA, Hamamci O. (2006). Interleukins 2, 6, and 8 levels in human gingival sulcus during orthodontic treatment. Am J Orthod Dentofacial Orthop 130:E1-6 - PubMed

Publication types

MeSH terms